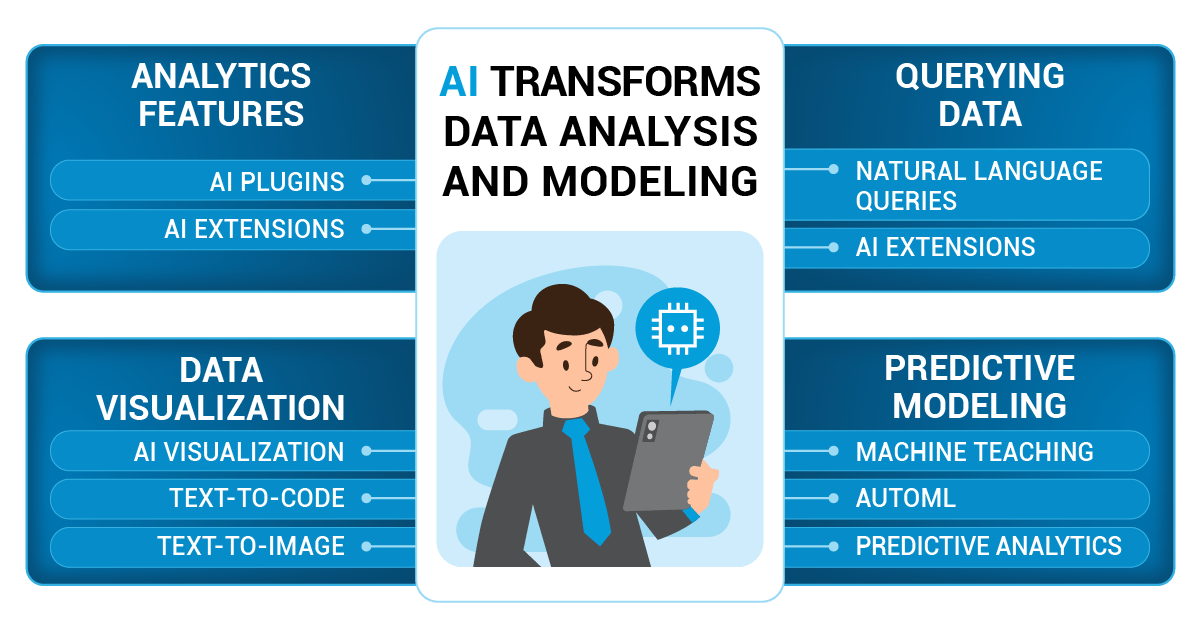
As the digital universe continues to expand at a mind-boggling pace, our ability to make sense of the vast amounts of data it generates is more critical than ever. This is where artificial intelligence (AI) steps in, transforming how we model and understand data, providing us with insights that were once out of reach.
At its essence, data modeling is about creating structures and relationships that allow us to extract valuable information from raw data. Traditional data modeling techniques, while robust, often struggle with the scale and complexity of today’s data. They require a high level of expertise and can be time-consuming. AI, on the other hand, can process vast amounts of data at speed, discern patterns, and create models that humans might overlook or find too complex to handle.
AI is redefining the boundaries of what’s possible in data modeling. Whether it’s predicting future sales, identifying customer behavior patterns, or forecasting stock market trends, AI-powered models can help us see what’s coming and plan accordingly. They bring efficiency and accuracy, turning the daunting task of data modeling into a streamlined process that delivers actionable insights.
How is AI being used to transform the way we analyze and model data?
Imagine being a sales rep and simply asking your computer, “Which are my top 5 leads for this week?” and getting a clear answer. Or, you’re an HR manager and you ask, “Compare John’s benefits with his performance reviews,” without having to dig through heaps of files. Sounds cool, right? This is all possible with the power of AI.
AI can help us use analytics features in the tools we already use
AI isn’t just a standalone technology; it’s an upgrade you can add to the tools you already love! Take Clara, an AI assistant, for instance. It’s a plugin that lives right in your calendar, scheduling meetings for you. You can communicate with Clara in everyday language, making it effortless to manage your appointments.
The days of writing complex queries to understand your data are over. AI allows us to ask straightforward questions in our own language, like “Show me sales data for last year,” and voila! The answer is at your fingertips. In this way, the use of plugins and extensions is playing a pivotal role in democratizing data analysis, opening up opportunities previously reserved for experts in the field.
Plugins:
These are like magic wands you can add to the tools you already use, like Excel. Remember our sales rep? They can use an AI plugin in Excel to ask questions and get answers instantly, without having to filter and search manually. The benefits include:
- Simplify Complex Tasks: AI plugins make complex tasks much easier. For example, a sales representative could use an AI plugin to quickly analyze sales data and identify patterns or trends.
- Increase Productivity: Since AI plugins handle complex and repetitive tasks, they free up time for you to focus on more important things. This increased efficiency leads to better productivity. Imagine not having to schedule meetings manually; an AI plugin like Clara can handle this job, leaving you with more time for critical thinking and decision making.
- Improved Accuracy: AI plugins are less prone to errors compared to humans, especially for monotonous tasks. This can greatly improve the accuracy of your work. For example, an AI plugin could accurately clean and preprocess your data, removing any inconsistencies and errors.
- Easy to Use: Many AI plugins are designed to be user-friendly and require little to no coding skills. You can often use natural language to instruct them, which makes these plugins accessible to everyone, not just those with a background in computer science or data analysis.
- Customizable: AI plugins can be trained and customized to perform specific tasks according to your needs. This is particularly beneficial for tasks such as forecasting sales or analyzing customer behavior, where the plugin can learn from past data to make accurate predictions.
- Round-the-clock Availability: AI plugins can work 24/7 without needing a break. This means they can provide continuous support, whether that’s scheduling meetings, answering customer inquiries, or analyzing data.
Extensions:
Think of extensions as superpowers for your web browsers or software. They let your software do more than it could before. Maybe you’re a marketer using an online tool. With an AI extension, you can predict trends before they happen!
- Enhance Existing Tools: AI extensions improve the functionality of existing software, platforms, or web browsers, adding new capabilities that weren’t there before. For instance, an AI extension might give your web browser the ability to automatically summarize articles or translate languages in real-time.
- Automation: AI extensions can automate a variety of tasks, increasing efficiency and productivity. From auto-completing your sentences to filtering spam emails, AI extensions can handle many repetitive tasks, freeing up time for more complex activities.
- Personalized Experience: Many AI extensions can learn from your behavior to provide a more personalized user experience. They can adapt to your preferences over time, suggesting content you might like, predicting what you might type next, or highlighting information you usually look for.
- Simplified User Interface: AI extensions often simplify user interactions with complex software or platforms. For example, an AI extension might allow you to control a sophisticated data analysis tool using simple voice commands or natural language queries.
- Real-time Assistance: Some AI extensions, like those for customer support, can provide real-time assistance to users, answering questions or providing help at any time of the day.
- Enhanced Accessibility: AI extensions can make digital tools more accessible. For instance, an extension might transcribe audio to text, helping those with hearing impairments, or convert text to speech, assisting those with visual impairments.
- Improved Decision-making: AI extensions can provide data analysis and predictive modeling, helping users make better-informed decisions. For instance, an AI extension might analyze website traffic data and provide insights into when visitors are most active or what content is most engaging.
AI can help us query our data
In today’s data-driven world, the ability to swiftly and accurately query large volumes of data has become a necessity. However, the traditional way of querying data – writing complex codes or SQL statements – can often be intimidating and time-consuming. Enter artificial intelligence (AI), a game-changer that’s revolutionizing how we explore and extract valuable insights from our data.
- Natural Language Queries:
Instead of typing complicated codes, you can just ask questions in plain English (or any language you prefer).Suppose you’re a marketing manager, and you’ve been running several campaigns over the past few months. You’ve collected loads of data from these campaigns – like impressions, click-through rates, conversions, and so on. Traditionally, to get specific insights, you’d have to write a complex SQL statement:SELECT Campaign, SUM(Conversions) FROM CampaignData
GROUP BY Campaign
ORDER BY SUM(Conversions)
DESC LIMIT 5;SQL query would fetch the top five campaigns based on the number of conversions. Now, with natural language querying powered by AI, you could simply ask your data analytics tool: “Which were my top five campaigns based on conversions in the last few months?” The AI interprets your question, translates it into a database query, executes it, and presents you the answer in a user-friendly format. It’s as simple as asking a question!
- Text-to-code:
Imagine typing, “Show me all the sales from last December,” and AI turns that into a computer code that fetches the data for you. Suppose you’re a marketing manager, and you’ve been running several campaigns over the past few months. You’ve collected loads of data from these campaigns – like impressions, click-through rates, conversions, and so on. Traditionally, to get specific insights, you’d have to write a complex SQL statement, something like:SELECT Campaign, SUM(Conversions) FROM CampaignData
GROUP BY Campaign
ORDER BY SUM(Conversions) DESC
LIMIT 5;This SQL query would fetch the top five campaigns based on the number of conversions. Now, with natural language querying powered by AI, you could simply ask your data analytics tool: “Which were my top five campaigns based on conversions in the last few months?”
The AI interprets your question, translates it into a database query, executes it, and presents you the answer in a user-friendly format. It’s as simple as asking a question!
AI can help us visualize our data
By transforming complex datasets into visual graphics, we can more easily understand, analyze, and make decisions based on our data. However, creating meaningful and insightful visualizations can be a time-consuming task that requires a level of expertise not everyone possesses. Enter the transformative power of artificial intelligence.
AI is revolutionizing the way we visualize data, making the process faster, more intuitive, and more insightful. By leveraging advanced algorithms and machine learning techniques, AI can sift through massive datasets, identify important patterns and trends, and then represent those findings in a visually appealing and easy-to-understand format. This could be a simple bar graph, a detailed heatmap, or even a dynamic, interactive 3D model.
- AI Visualization:
AI doesn’t just give you numbers; it can paint a picture (literally!). Remember how our sales rep used AI to create a map showing where all the leads came from? That’s AI visualization in action. Suppose you’re a marketing manager, and you have data related to various marketing campaigns, including the campaign’s name, start and end dates, budget, and outcomes such as impressions, click-through rates, and conversions. You want to see which campaigns have performed best in terms of conversions, but your data is in a spreadsheet and isn’t easy to understand at a glance. By using an AI-powered data visualization tool, you can simply ask: “Show me the conversion rates of all marketing campaigns in the past year.” The AI tool would then process your request, analyze your data, and create a bar chart with each campaign on the x-axis and their respective conversion rates on the y-axis. This chart allows you to quickly see which campaigns had the highest conversion rates. To take it a step further, you might then ask: “How do conversion rates relate to the budget of each campaign?” In response to this, the AI tool could create a scatter plot that shows the relationship between the budget for each campaign (x-axis) and the conversion rate (y-axis). - Text-to-code & Text-to-image:
Type what you want to see, and watch AI create it. Want a pie chart for this month’s expenses? Just ask! Or a map of all your clients? Type it in, and see it appear. Imagine you’re a project manager with data on the progress of various tasks within a project, including the task names, assigned team members, start dates, end dates, and completion status. The data is comprehensive but difficult to understand when looking at the raw numbers in a spreadsheet. With an AI-powered text-to-image tool, you could input a request like: “Generate a Gantt chart showing the timeline of all tasks in the project.” Upon receiving this text instruction, the AI tool would analyze your data and generate a Gantt chart image. This chart would visualize each task as a horizontal bar spanning from the start date to the end date, giving a clear depiction of the project timeline and the overlap between different tasks. The generated Gantt chart would allow you to understand the project schedule easily, observe the duration and overlap of tasks, and track the progress of the project visually.
AI can help us build predictive models
Harnessing the power of artificial intelligence, we can transform raw data into future insights with predictive modeling. But what exactly does it mean to build a predictive model with AI, and why is it becoming an essential tool in various professional domains? Predictive modeling, at its core, is about using statistics to predict outcomes. From predicting customer behavior in marketing, estimating sales in business, forecasting patient outcomes in healthcare, to anticipating system failures in IT, AI-powered predictive models are becoming increasingly important in a wide range of fields.
- Machine Teaching:
Thanks to machine teaching, a method where you teach an AI model as you would a student, even non-experts can create AI models. This is a significant leap in democratizing AI and making it more accessible to everyone. In machine teaching, you, the expert, teach machines to think like you. Like our pet owner teaching an AI model to recognize when the dog’s water bowl is empty. You can use photos, data, or examples to train AI, making it an assistant that thinks like you! Let’s consider a business scenario where a company wants to predict which customers are likely to churn, i.e., stop doing business with them. This is a common issue many businesses face and would greatly benefit from an accurate predictive model. In this case, a customer relations manager named John, who isn’t a data scientist but understands the business and its customers well, decides to use machine teaching. Here’s how John could use machine teaching:- Define the task: John first defines the problem as predicting customer churn. He identifies that factors such as frequency of purchases, customer complaints, and response to promotional offers might influence a customer’s decision to churn.
- Provide examples: John gathers historical data about customers who have churned and who haven’t. He then pairs this data with the associated outcomes (churn or not churn).
- Teach the model: Using an AI tool with machine teaching capabilities, John inputs this data. The tool uses these examples to learn and understand the patterns associated with churn.
- Iterate and improve: After the initial model is built, John tests its predictions against some data it hasn’t seen before. He finds some predictions are incorrect, identifies where the model might be going wrong, and provides more examples to help the model learn from these mistakes.
- Use the model: Once the model is performing well, it’s used to predict churn in real-time. It’s able to flag customers who show signs of leaving, allowing the customer relations team to proactively address these cases, perhaps by reaching out to the customer to understand their concerns and offer solutions.
This scenario shows that even without a background in data science, domain experts like John can use machine teaching to create valuable predictive models. By using their unique insights and knowledge, they can teach AI to solve problems specific to their field, making machine teaching an incredibly powerful and accessible tool for businesses.