Picture this: You wake up, look at your phone, and see a notification that your daily screen time has increased by 40%. You’d feel concerned, wouldn’t you? But then you remember: yesterday, you spent hours on a video call catching up with old friends. Suddenly, that 40% increase isn’t an alarming reflection of digital addiction but a cherished memory of connection and laughter.
This, folks, is the power of context.
Imagine, for a moment, your life as a dataset: every interaction, every step, every heartbeat—an endless series of data points. Now, taken individually, these data points may seem trivial, mundane, or even bewildering. But a unique narrative unfolds once you stitch them together, add context, and examine the patterns. Your narrative. The story of you.
Yet, this process doesn’t apply just to our personal lives; it’s a crucial practice in the vast world of data analytics. Today, we will delve into context’s role in data storytelling. Like our screen time example, datasets can be overwhelming, intimidating, and misleading if we don’t understand the surrounding circumstances.
Gathering and Defining Foundational Information
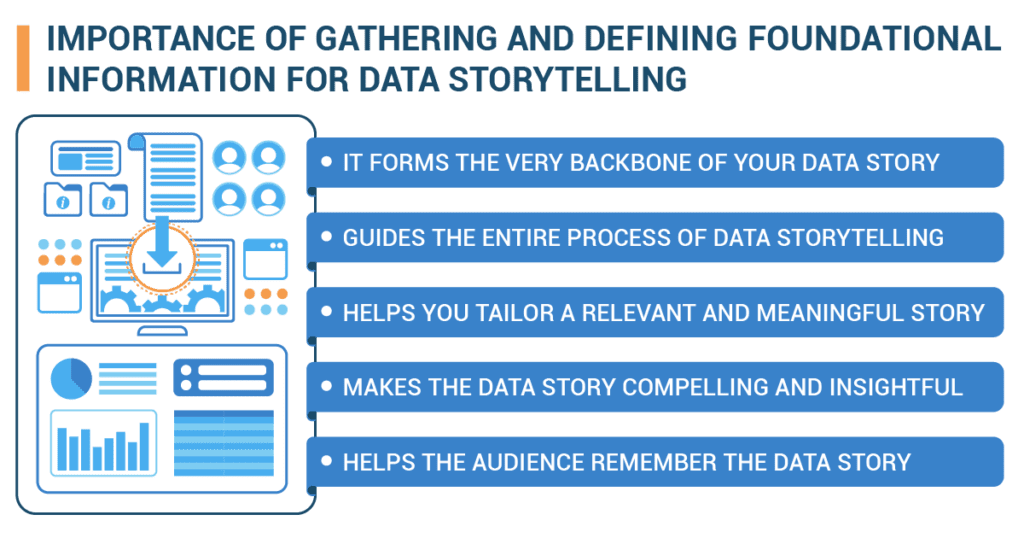
So, why must we gather and define foundational information for data storytelling? Well, imagine trying to solve a case without knowing what crime was committed, who might have seen it, or what evidence to look for. You’d be lost!
The same goes for data storytelling. We need a clear purpose, like why we’re investigating this data. Is it to understand why the school cafeteria is always out of pizza on Wednesdays? Or maybe we want to figure out if taller students are better at basketball? The purpose guides everything we do next. It shapes the direction of the data analysis, determines the relevant insights, and influences the design of the narrative.
Then, we need to know our audience or who we’re telling the story to. Are we explaining the pizza problem to the lunch lady or the basketball situation to the coach? We’ll need to adjust our language and how much detail we give depending on who we’re talking to.
And, of course, we need our findings – the actual data. These facts, figures, trends, and patterns in the data will help us tell our story. It’s like the detective finding a footprint at the crime scene – a crucial clue!
Finally, we have our core message – the main thing we want our audience to remember. Like a detective concluding that the butler did it, our core message could be, “The cafeteria needs more pizza on Wednesdays,” or “Height doesn’t determine basketball skills.” A well-defined core message can help the audience understand, remember, and act upon the data story.
Uncover a Data Story Worth Telling
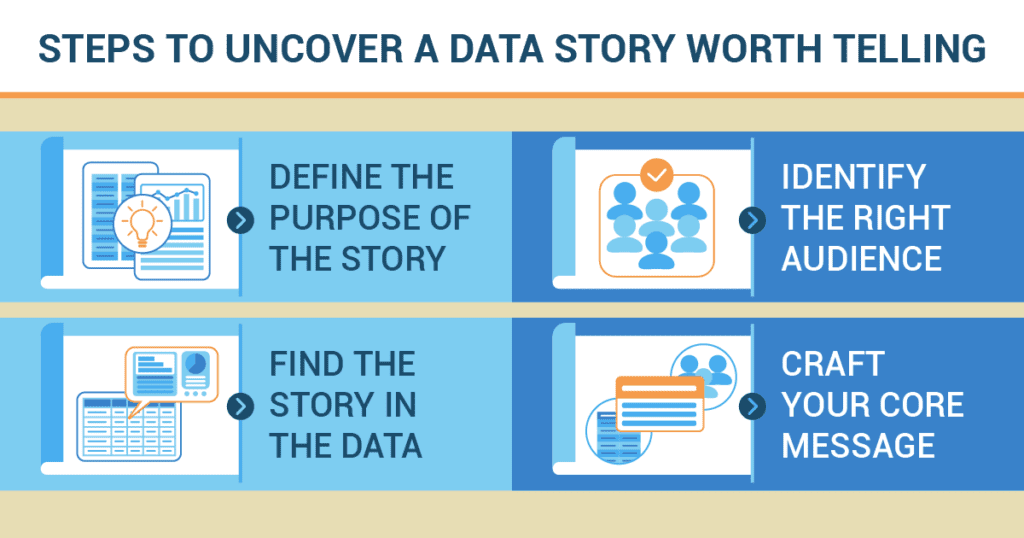
So, how do we uncover a data story worth telling? Let’s use the example of why the cafeteria always runs out of pizza on Wednesdays.
- Define the story’s purpose: We want to figure out why the cafeteria keeps running out of pizza on Wednesdays.
- Identify the right audience: Our audience is the lunch lady and the school principal because they have the power to fix the problem.
- Find the story in the data: We start gathering data – maybe we survey students about their favorite lunch meals or check the cafeteria records. We discovered that more students stay for lunch on Wednesdays because of after-school activities, and pizza is their favorite meal.
- Craft your core message: Based on our findings, our core message (key takeaway) is, “The cafeteria needs to make more pizza on Wednesdays because more students eat lunch at school that day due to after-school activities.”
Clicks, Likes, and Selfies: A High Schooler’s Deep Dive into Social Media Habits
 Henry’s fascination with social media started when he noticed something peculiar. His classmates were always hooked to their phones. Whenever there was a free moment, the familiar scrolling gestures came alive. But what was it that kept his peers so engrossed? The high school junior decided to investigate using the tools he’d learned in his statistics class.
His purpose was clear from the beginning: to understand his classmates’ social media usage habits. This wasn’t an assignment or a task for extra credit. It was pure curiosity, a personal quest to uncover the invisible threads tying his friends to their screens.
Knowing he’d share his findings with his classmates and maybe even the school’s newspaper, Henry understood his audience well. He knew they were well-versed in social media lingo and internet trends, which meant he could weave in those details without confusing them.
Henry designed a survey, asking his peers about their favorite platforms, time spent on each, and what content they usually interacted with. He distributed the survey during homeroom and lunch breaks, ensuring a broad reach across different social groups.
The data started to roll in, and Henry got to work. He compiled the responses into a spreadsheet, converting the raw numbers into something more visual. His classmates’ screen-time habits became bar graphs and pie charts, revealing previously hidden patterns.
Instagram was the most popular platform, followed by TikTok and then Snapchat. However, the context Henry found most interesting was the type of content his peers were most engaged with. Many students preferred posts from friends and family, but many also followed influencers and watched many how-to videos.
But, the most compelling insight came from cross-referencing time spent on each platform with the type of content consumed. Those who spent the most time on Instagram primarily engaged with influencers, while those who spent more time on TikTok were learning new skills from the how-to videos.
Henry drafted his core message around these findings: “Our social media habits reflect a balance between connection and aspiration, between friends and heroes.”
Ultimately, Henry shared his findings in an assembly, presenting his data story with well-crafted visuals. His classmates were captivated, seeing their daily routine reflected in Henry’s unearthed patterns.
For Henry, this was just the beginning. His quest had successfully used data storytelling to shed light on a contemporary issue. The invisible threads were no longer hidden, and Henry felt a newfound clarity about the world he and his classmates were navigating.