Truncated axes, also known as clipped or broken axes, are the result of cutting off a portion of an axis in a chart to focus on a specific range of data values. Truncated axes can be used when you want to emphasize a particular range or a specific portion of the data. By truncating the axis, you can zoom in on the relevant part of the chart and provide more detailed information within that range. While this practice may be necessary, it can also lead to incorrect interpretation, as it doesn’t show the true context of the data.
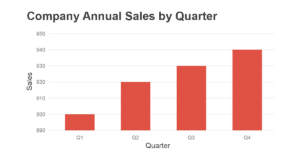
For example, imagine we have a dataset showing the sales of a company over four quarters. They sold 900 units in Q1, 920 in Q2, 930 in Q3, and 940 in Q4. If we create a bar chart starting the vertical axis at 0, it will show that there is a steady increase in sales over time. However, suppose we truncate the axis to start at 890 or 895. In that case, it will make the differences between quarters look exaggerated, giving the impression that sales are skyrocketing, which, in reality, isn’t the case.
Now, let’s talk about how to avoid this issue:
- Start from zero: Whenever possible, start the axis at zero to show the true context of the data. This will ensure that the data is presented naturally and accurately, reducing the chances of being misinterpreted.
- Use a different chart type: If you think the differences in your data are too small to observe on a chart starting from zero, explore using other chart types that can better represent smaller differences. For example, consider using a line chart with markers, which helps users visualize differences between data points more easily.
- Clearly label the axis: If you must truncate the axis to emphasize a particular aspect of the data, ensure that the axis is clearly labeled to avoid confusion. Make it evident that the axis is truncated by indicating the range of values shown on the axis with clear, concise text.
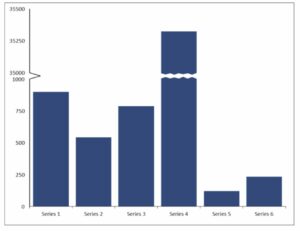
- Consider using additional visual indicators: If the data representation requires truncating the axis, you can add a visual element to the axis to indicate that it has been truncated. This could be a break symbol on the axis, like a jagged line, to show that the values were cut off. Labeling the break provides transparency and indicates that a portion of the data is not displayed. This promotes ethical data visualization practices and ensures that viewers are aware of the manipulation or exclusion of data.
By taking these steps, you’ll be able to avoid the pitfalls of truncated axes and create more accurate and honest representations of your data. And always remember that an effective data visualization should look appealing and provide a clear, understandable representation of the underlying data.