Chart scaffolding is the framework on which we build our visuals to tell data stories, so it’s essential to have a solid foundation. Here are some common pitfalls in data visualization design and how to avoid them.
- Inconsistent axis scales can lead to the misinterpretation of the data’s patterns and relationships. For instance, imagine a bar chart that shows the number of calls received per day for a week. If the x-axis (horizontal) were marked by inconsistent intervals of days, it could give the impression that certain days had more or fewer calls than they actually had.
To avoid this, ensure that the axis scales are consistent and proportional. In our example, ensure that the distance between each day on the x-axis is the same.
- Overloading with information can make visuals cluttered and hard to interpret. For example, a pie chart displaying the income sources for a company might have too many categories, making it difficult to discern which segments are larger or smaller.
To avoid this, keep the visuals clean and focused. Consider streamlining the data, splitting it into multiple charts, or using a more appropriate chart type that can handle the complexity. In our example, consider using a bar chart instead of a pie chart or grouping the smallest income sources into an “other” category.
- Misleading color schemes can mislead audiences or create confusion. For example, using a continuous color gradient for categorical data does not effectively communicate the data points’ distinction.
To avoid this, choose appropriate color schemes that suit the data type and enhance visual clarity. For categorical data, select distinct and contrasting colors. Use a color gradient to represent the progression more naturally for continuous data.
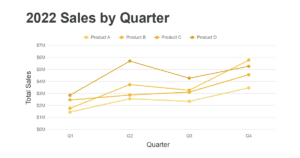
- Inappropriate chart types can create confusion, misinterpretation, or lack of engagement with the data. For instance, using a line chart to represent the favorite ice cream flavors in a survey is not suited, as the data is not continuous.
To avoid this, understand the data structure and choose chart types that best represent the patterns and relationships within the data. In our example, a bar chart or pie chart would be more appropriate to represent the favorite ice cream flavors.
- Insufficient labels and annotations can make extracting meaning from the chart difficult. For example, a bar chart showing the annual revenue growth for five years could be difficult to interpret if the years and revenue figures are not properly labeled.
To avoid this, make sure your visuals have descriptive titles, clear labels, and explanatory annotations. In our example, label each bar with the corresponding year and revenue, and add a title that accurately describes the visualization’s purpose.