Consider you’re assembling a jigsaw puzzle. 🧩 You’ve spent hours on it, placing each piece meticulously. The picture is almost complete – a scenic countryside with lush fields, a blue river winding through, and a vibrant sunset.🌅 Yet, there’s one piece missing 😱- that crucial bit that completes the sun. How would the picture look? Incomplete.😢
Life, as you see, revolves around completeness, and so does the realm of data science. Just as the missing puzzle piece leaves your image unfinished, missing or incomplete data can drastically alter the insights we derive, leading to potentially faulty decisions and strategies.
Today, we’re diving into the fascinating world of exploring data completeness. We’ll see why it’s more than just filling in the blanks; but instead, it’s about creating a complete picture that enables us to see patterns, make informed decisions, and, most importantly, understand the world around us in a more profound way.
What is Data Completeness, And Why Is it Important?
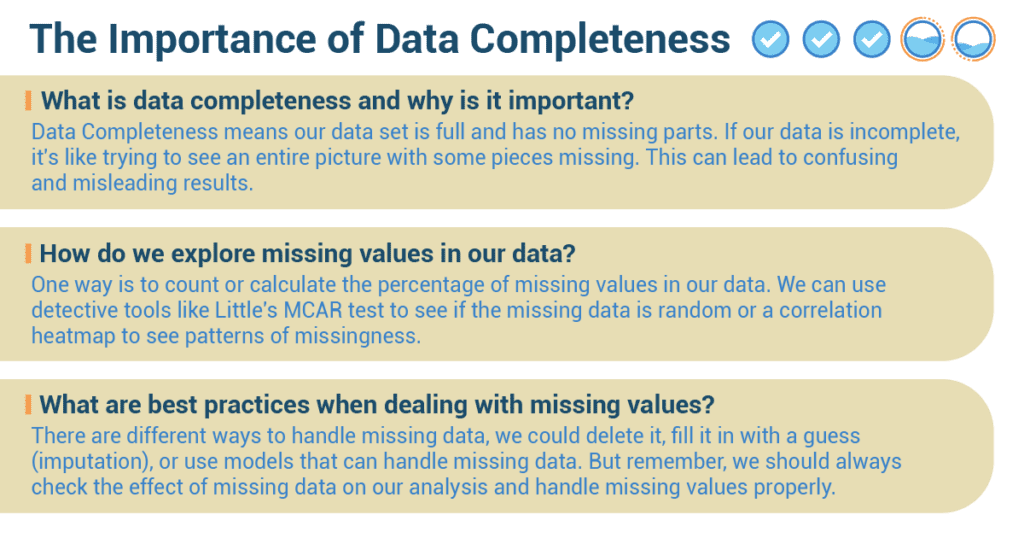
In the world of numbers and data, we need all the pieces of the puzzle, all the scores from the game, to understand the whole story. This is what we call ‘Data Completeness.’ It means our data set is full and has no missing parts (absent values), like a completed jigsaw puzzle.
- If our data is incomplete, it’s like trying to see an entire picture with some pieces missing.
This can lead to confusing and misleading results. Think about how you felt when you didn’t know the final score of your soccer game! - Incomplete data can make machine learning models not work well.
In the tech world, there are smart machines that learn from data, called machine learning models. These models could get confused and make mistakes if they come across missing values, just like how you would make a mistake if you didn’t know the full instructions for a homework assignment. These machine learning models might not work as expected when they come across missing values, leading to wrong or not the best predictions. - Incomplete data can make our preprocessing steps tricky.
Preprocessing is like getting our data ready before we use it for different tasks. But when our data has missing parts, it can make the preparation steps a bit harder. Deciding how to deal with missing values can influence the outcomes of our entire analysis. - Missing data can affect how we understand the distribution and relationships in our data.
For example, if we have missing information about people’s ages in a survey, it might make it difficult to accurately analyze the age distribution and its impact on other variables like income or education level. This can lead to incomplete or misleading insights.
How Do We Explore Missing Values in Our Data?
- Identifying missing values.
The first step in tackling missing values is finding them. It’s like playing detective in a mystery game. We have cool techniques to help us with this:- Numeric: One way is to count or calculate the percentage of missing values in our data, just like how you might count how many questions you got wrong on a test.
- Visual: We can also use visuals like a matrix or a heatmap (a color-coded chart), just like how you might use a color-coded schedule to see which periods you have for each subject.
- Understand why values are missing.
We also need to figure out why values are missing. Sometimes, it’s random, and sometimes, it’s related to other data. We can use detective tools to help us:- Numeric: Tests like Little’s MCAR test help see if the missing data is random.
- Visuals: A correlation heatmap helps identify patterns of missingness.
What are Best Practices When Dealing with Missing Values?
- When dealing with missing values, it’s important to understand the context, like knowing the rules of a game.
The effect of missing data depends on the context. If key variables have lots of missing values, the analysis may not be accurate. We always need to understand the importance of variables with missing data. Without understanding the context, it’s hard to decide how to deal with missing data.- For example, if you’re missing the scores of key players in your game, the final result might not be accurate. Similarly, we need to understand the importance of missing data in our analysis.
- Deal with missing data properly.
There are different ways to handle missing data, just like there are different ways to handle a forgotten homework assignment. We could delete it, fill it in with a guess (imputation), or use models that can handle missing data. The choice depends on why and how much data is missing and what we’re trying to find out.- Imagine you have collected data about your classmates’ favorite colors, but some students didn’t provide their color choices. To handle the missing data properly, you could fill in the missing colors based on what other classmates like or use a model to predict their favorite colors accurately, depending on how much data is missing and what you want to find out.
- Don’t just delete missing data.
A common mistake is to just delete any data with missing values without understanding why it’s missing. This could create bias or loss of valuable information. Before deleting, we need to understand why the data is missing and consider other methods like imputation.- Suppose you conducted a survey about students’ transportation to school, and some responses regarding transportation were missing. Instead of just deleting those responses, you need to understand why that information is missing. For example, some students might not have answered because they walk to school or carpool, so you could impute those values based on the most common mode of transportation to avoid bias or losing valuable information.
- Don’t ignore the effect of missing data.
We should always check the effect of missing data on our analysis and handle missing values properly. Ignoring missing data is like ignoring a foul in a soccer game – it can lead to wrong or misleading results.- Imagine you are studying the relationship between students’ sleep patterns and their academic performance. If you ignore the missing data for some students’ sleep hours, you might draw inaccurate conclusions. Just like a soccer referee should not ignore a foul during a game, you should handle missing data properly to avoid wrong or misleading results in your analysis.
Digital Detective: Henry’s Dive into Social Media Data
 Henry, a curious junior at Riverview High School, found himself with a new assignment for his Statistics class: explore a dataset and present the findings. Always interested in the world of social media, he decided to analyze a dataset that captured various metrics from popular social media platforms.
He got his data from a public dataset online. It had entries spanning multiple years and included data from different social media platforms, capturing metrics like user engagement, time spent, and demographic information.
Right from the start, Henry knew that diving into the dataset without checking for completeness would be like running into a soccer game without his shin guards – risky and ill-advised. So, he started his mission by investigating the dataset’s completeness.
He began by scanning the metadata and initial observations to get a sense of the data landscape. He noticed that some of the user engagement numbers for some platforms in certain years seemed to be missing. His first hunch was to ignore these entries, but recalling his class lessons, he realized it was essential to understand the missing data’s nature before deciding how to handle it.
To gauge the scale of the problem, Henry used a numerical approach and calculated the percentage of missing data for each variable. It turned out the missing values in user engagement were relatively few, but an important metric like that missing could be like not knowing the score in a championship game.
Moving forward, he decided to visually represent the missing data using a heatmap. This gave him a clear picture of where exactly he was facing gaps. It was quite evident that the missing engagement data was concentrated around the earlier years for a few platforms.
To dig deeper into why these values were missing, Henry made an educated guess: Could it be that these platforms were new during those years and hence had lesser data available? Or was the data not collected consistently during the initial years?
To explore his hypothesis, he performed Little’s MCAR test. The results suggested that the missing data wasn’t random – reinforcing his hypothesis that the data’s missingness was related to the platforms’ novelty.
Henry had an important decision to make: How to handle this missing data? Deleting the entries with missing values was tempting, but he knew this could introduce bias or lose valuable context.
Given the importance of the missing metric and his understanding of why it was missing, he decided on a more appropriate method: imputation. He chose to estimate the missing values based on the existing data from those early years, a decision backed by his analysis and understanding of the data’s context.
In the end, Henry presented his findings on social media trends to his classmates, highlighting his journey through data completeness. His careful consideration of missing data not only ensured a robust analysis but also fetched him the top grade, earning him the class title of ‘Digital Detective’. This exercise underscored for Henry the critical role that data completeness plays in exploring and interpreting data effectively.