In our everyday lives, we encounter mysteries and unanswered questions that pique our curiosity. 🤔 Whether it’s deciding which route will get us home fastest or wondering if our favorite sports team will win the championship 🏆, we constantly find ourselves making assumptions and seeking answers. 🔍 Little do we know that within these ordinary experiences lies a remarkable tool called hypothesis testing, which holds the key to uncovering the truth and transforming the way we understand the world around us.
Hypothesis testing surrounds us in various forms. It empowers us to make evidence-based decisions, ask the right questions, and separate fact from fiction. By delving into the world of hypothesis testing, we can become detectives in our own lives, seeking the truth and unraveling the mysteries that lie before us, from choosing the best smartphone on the market 📱 to evaluating the effectiveness of a new workout
routine 💪.
What is a Hypothesis Test?
A hypothesis test is like a special detective toolkit that lets us use a small piece of the puzzle (sample data) to guess what the whole picture (population) might look like. Think of it like trying to guess what your whole school likes for lunch by asking a few of your friends. You’re using a small group (sample data) to guess the preferences (inferences) of everyone in your school (population). One really cool thing about a hypothesis test is that it doesn’t just help us make these guesses—it also tells us how sure we can be about them! This is the role of a p-value, a measure of confidence.
The Steps in Hypothesis Testing
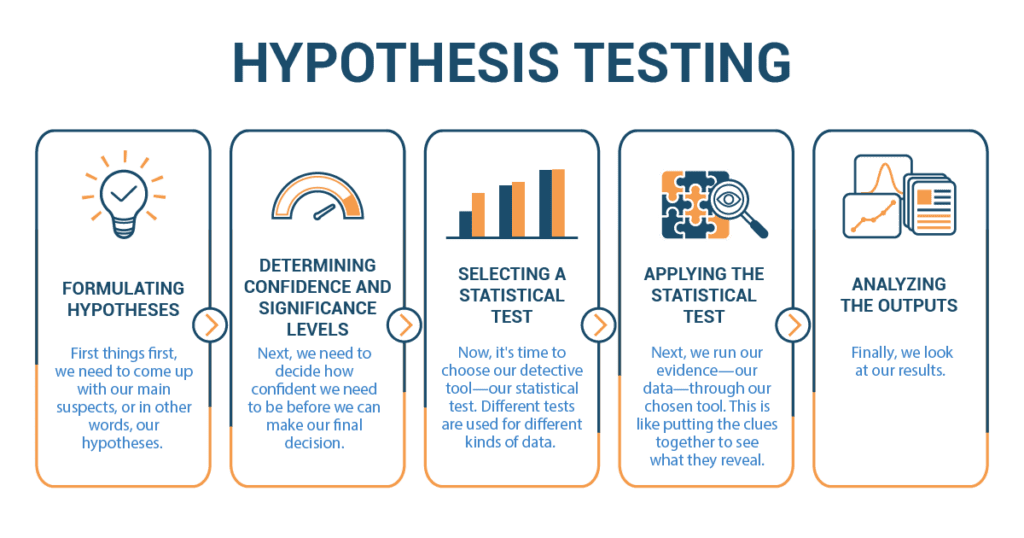
- Formulating Hypotheses: First things first, we need to come up with our main suspects, or in other words, our hypotheses. Let’s say we’re trying to figure out if more high schoolers prefer pizza over burgers.
Our null hypothesis (H0) would be “High schoolers prefer burgers or have no preference,” while our alternative hypothesis (H1) would be “High schoolers prefer pizza.” - Determining Confidence and Significance Levels: Next, we need to decide how confident we need to be before we can make our final decision. This is our confidence level. If we’re 95% confident, it means we’re okay with being wrong 5% of the time.
Our significance level is like figuring out how strong our evidence needs to be before we declare pizza as the most liked food. If we choose a significance level of 5%, we’re saying that we need a p-value less than 5% (often written as .05) to claim that pizza is the preferred food. - Selecting a Statistical Test: Now, it’s time to choose our detective tool—our statistical test. Different tests are used for different kinds of data. In this case, we might use a chi-square test, which is great for comparing observed and expected data—like the number of students who prefer pizza versus what we expected.
- Applying the Statistical Test: Next, we run our evidence—our data—through our chosen tool. This is like putting the clues together to see what they reveal.
- Analyzing the Outputs: Finally, we look at our results. If our p-value is less than our significance level (5%), we’ve got strong evidence to say that pizza is indeed the high schoolers’ preferred lunch option!
Hypothesis testing is all about making educated guesses and then seeing how likely it is that our guess is correct. It’s not a crystal ball, but it’s a mighty useful tool for solving mysteries in the world of data. So, grab your detective hat, and let’s get started on our next data investigation!
Basketball Performance: A Case Study
 Meet Sasha, a high school sophomore and the captain of her school’s basketball team. Like all athletes, she’s always looking for ways to improve her team’s performance. Recently, she read an article stating that teams that practice meditation regularly improve their free throw success rate. Intrigued, Sasha wondered if introducing meditation to her team’s training regimen could enhance their performance.
This was Sasha’s hypothesis: “Implementing meditation in our training will increase the team’s free throw success rate.”
Knowing that a hypothesis is merely an informed assumption that needs to be tested, she started her mini-research project. She collected data on the team’s free throw success rate for three months, during which no meditation practices were conducted. This gave her a baseline to compare against.
Then, she introduced a 15-minute meditation session before each training for the next three months. After each month, she recorded the team’s free throw success rate.
But Sasha didn’t stop there. She understood that her investigation was a small reflection of what statisticians and researchers do all the time. They make an educated guess, or a hypothesis, about a possible relationship or effect. They then gather data, like she did with her team’s free throw rates, to see if the evidence supports their hypothesis.
After three months of implementing meditation, Sasha analyzed the data. She noted that there was an increase in the team’s free throw success rate. Her teammates also reported feeling more focused and less anxious during the games. While Sasha knew that this small study didn’t definitively prove the benefits of meditation for all basketball players, she was encouraged by the results.
In the grand scheme of things, what Sasha had conducted was a simple form of a hypothesis test. She had a hypothesis, collected and analyzed data to test it, and made conclusions based on her results.
Her little experiment underscored the importance of understanding hypothesis testing: it provided her with a structured way to explore an idea, gather evidence, and make informed decisions. And who knows? Maybe her findings will inspire others in her school to consider meditation as part of their training regimen too.