Choropleth, cartogram, bubble map, flow map, and isopleth are five useful chart types for displaying geospatial patterns. Here is some information to help you understand their characteristics and benefits.
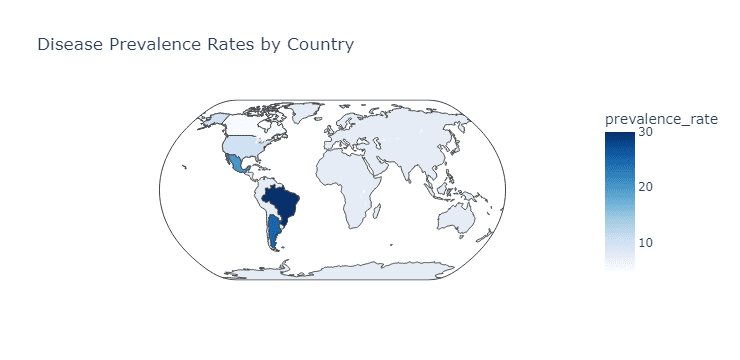
- Choropleth maps display data using different colors or shading patterns for different regions within a given area. For example, suppose we want to visualize the disease prevalence rates worldwide. In that case, we might use different shades of blue to represent different density levels – the darker the blue, the denser the population. Choropleth maps are great for showing patterns such as political party dominance, income levels, and pollution rates.
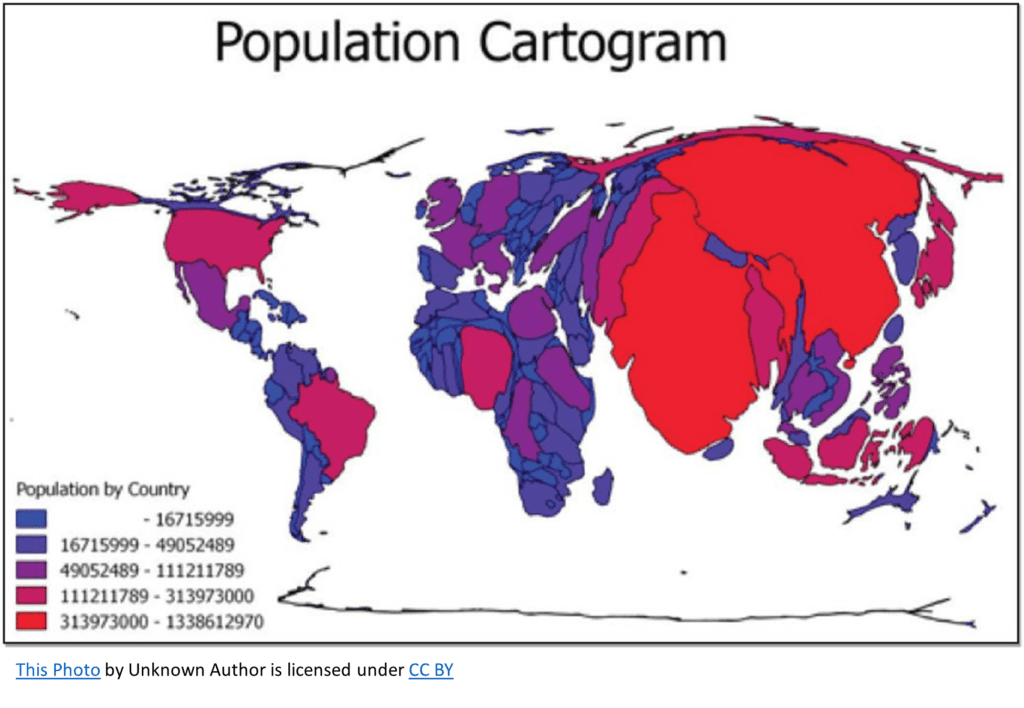
- Cartograms are unique in that they scale and distort the shapes of geographical regions based on a particular data set. Cartograms can quickly make data more visually engaging by creating easily recognizable patterns. For example, imagine we want to show the total population of each country. In a cartogram, the size of each country would be scaled based on its population- countries with a larger population would appear more prominent on the map than countries with smaller populations. Cartograms can be helpful in showing data comparisons like population size or economic measurements.
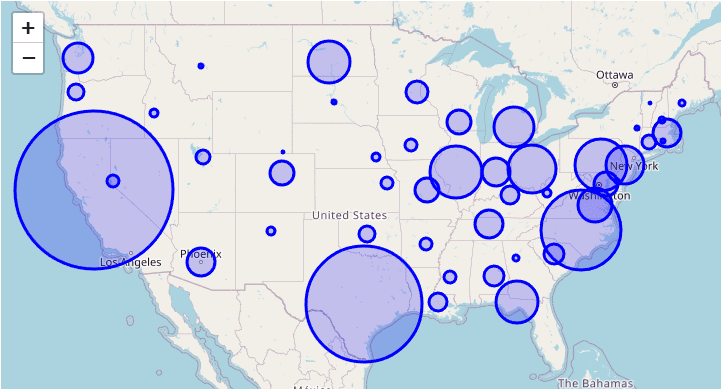
- Bubble maps are similar to choropleth maps in that they display data using geographical regions, but instead of using shading or colors, bubble maps use circles to represent the data. The size of the circle is proportional to the value it represents. For example, if we were to create a bubble map displaying the population of different U.S. states, the larger the bubble, the higher the population in that state. Bubble maps efficiently show the relative sizes of a specific data point across different locations.
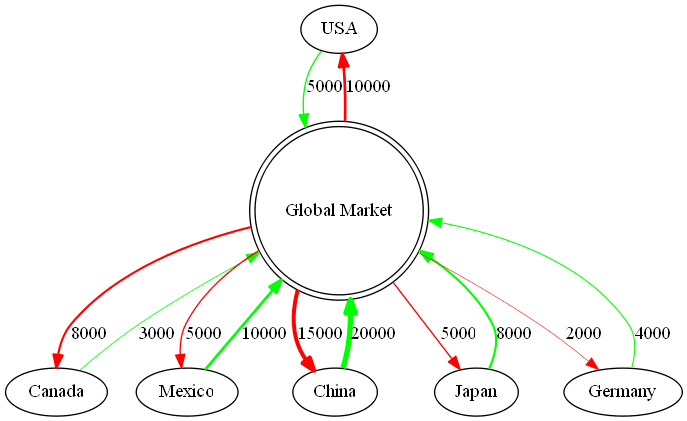
- Flow maps are excellent for showcasing the movement of data over a geographical area. They use arrows and lines to represent the direction and intensity of the flow. For example, suppose we wanted to show the change in global market share for different countries. In that case, we might use flow lines to connect the countries, with the line thickness indicating the amount of market share gained or lost. Flow maps can also be used to showcase trade routes, transportation trends, and even the flow of information.
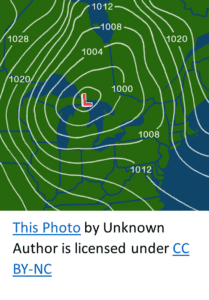
- Isopleth maps use continuous lines or contours to represent specific data thresholds. Those lines connect points of equal value. A well-known example is a topographic map, where lines represent changes in weather conditions. Isopleth maps can be used to visualize many data types, such as temperature, air pressure, and even pollution levels.
Using these five geospatial chart types, you can design highly effective visuals to help you convey complex information with just a glance.