Below are some common and effective charts that can help identify and display time-related patterns in data.
- Line chart: A line chart is one of the most popular ways to display time-related patterns. Line charts are excellent for showing continuous data over time, making it easy to spot trends, patterns, or seasonal fluctuations.
For example, imagine you want to visualize the monthly sales of a retail store. A line chart can effectively display this by connecting the data points (monthly sales) with a line representing the overall trend.

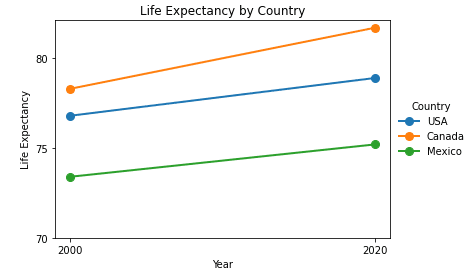
- Slope graph: A slope graph is another helpful way to show trends and comparisons over time. They typically involve two vertical axes displaying related data, connected by lines representing the change between these values.
A slope graph can showcase the life expectancy of different countries over the last two decades. By connecting the dots or data points from the start to the end of the decades, the slope of the line shows whether there has been an increase or decrease in life expectancy.
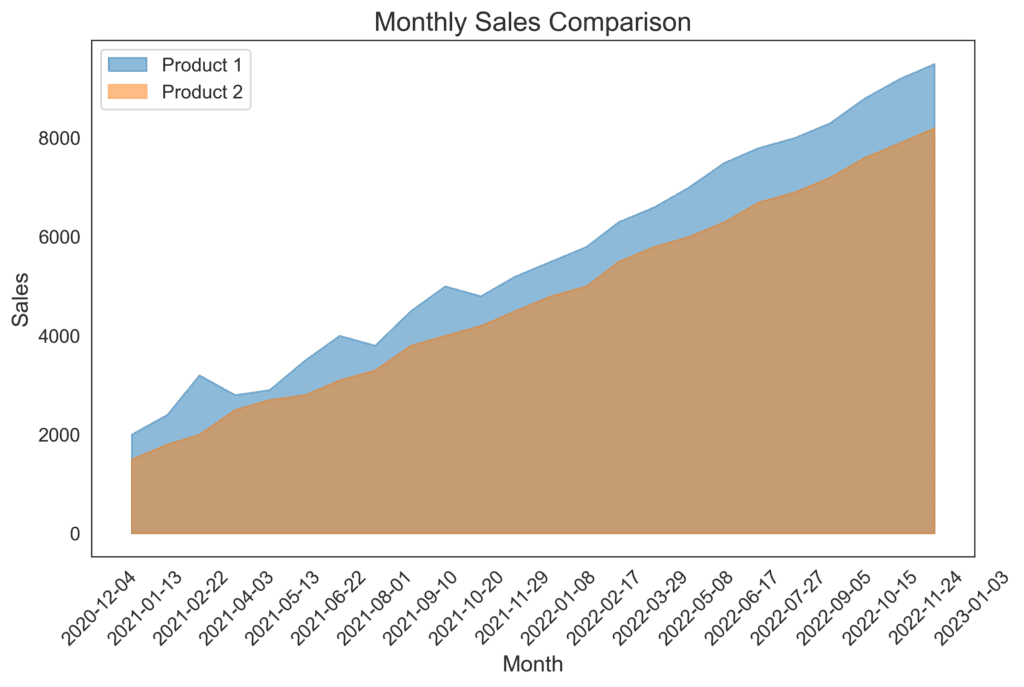
- Area chart: As the name suggests, area charts are similar to line charts but filled with color to represent the volume or magnitude of the data being depicted. This can help to highlight fluctuations or differences between multiple datasets visually.
With an area chart, you can easily track the market share of three competing products over several years and see if the products’ market share remains stable or if one product gains popularity over others.
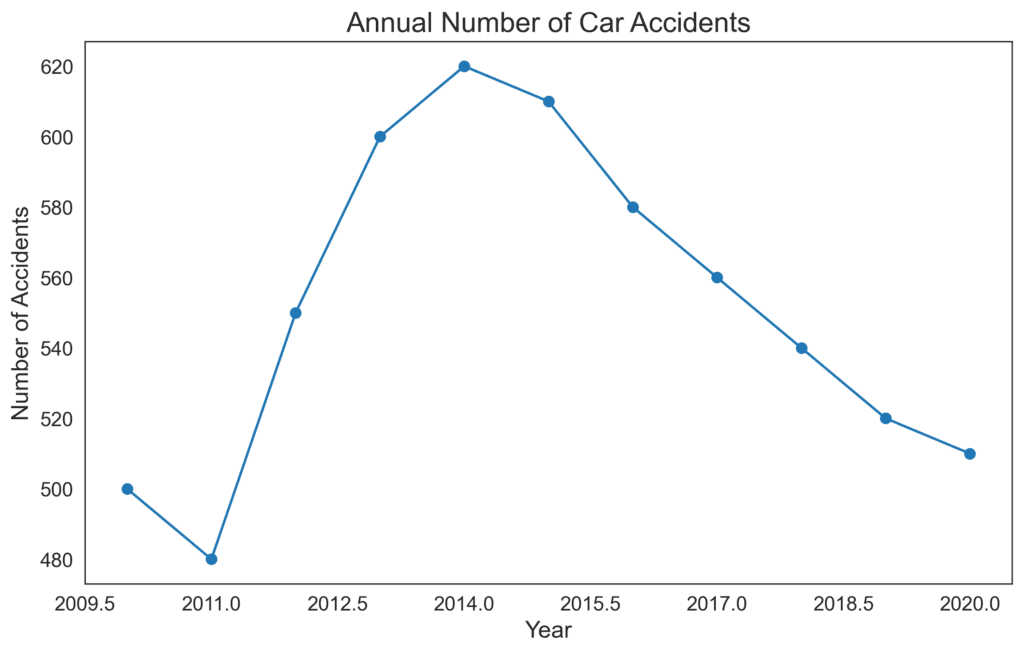
- Connected dot plot: A connected dot plot is another valuable way to display time-related patterns. It typically involves placing data points on a horizontal axis to represent time and connecting these data points using lines or curves to help visualize trends.
For instance, when examining the annual number of car accidents in a city over the last ten years. The connected dot plot can help highlight any significant trends in the data and make it easy to see if accidents have been increasing, decreasing, or remaining consistent over time.