Displaying categorical-categorical data in a chart means visualizing relationships or comparisons between two sets of categorical data. Categorical data, unlike numerical data, represents qualities or characteristics that can be sorted into different groups or categories, but not measured numerically. Being able to visualize data effectively is crucial to make informed decisions and to tell compelling data stories. Here are a few types of charts that work particularly well for categorical data – grouped, stacked, and multi-series charts.
Grouped Bar Charts
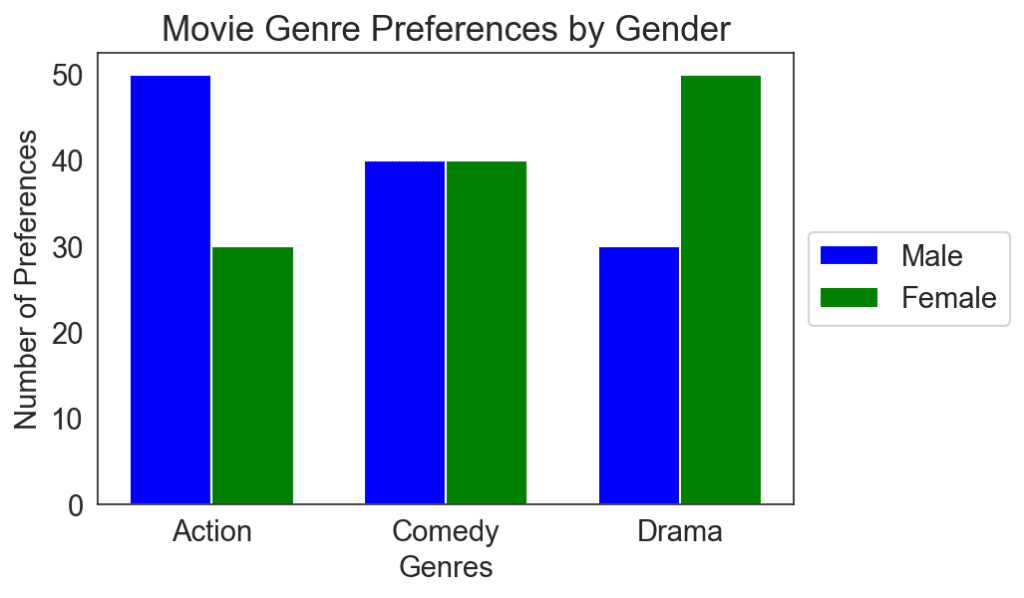
These are an excellent choice for displaying categorical data when you want to compare multiple series or categories. This chart type takes individual bars representing different categories and groups them together based on a common variable.
When looking to understand the preferences of three movie genres–action, comedy, and drama–among males and females, a grouped bar chart can display the number of males and females who prefer each genre in separate bars, side by side. This visual helps your audience understand the preferences of both genders for each movie genre easily and quickly.
Stacked Bar Charts
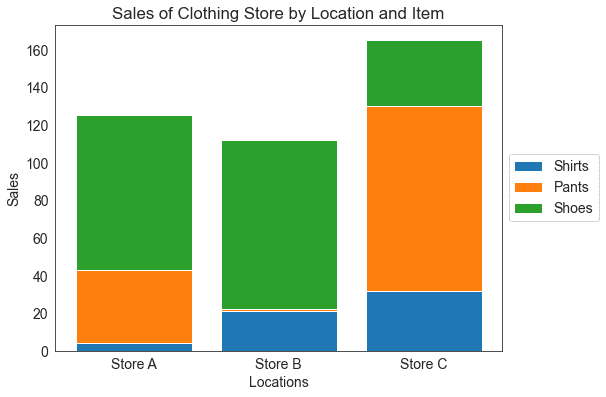
Stacked bar charts are another powerful way to display categorical-categorical data. They involve taking individual bars, each representing a category, and stacking them on top of one another. This type of chart is useful when you want to emphasize the part-to-whole relationship within each category.
A stacked bar chart can support visualizing the sales data of a clothing store, where you have different clothing items (shirts, pants, and shoes) and different locations (stores A, B, and C). It can display the total sales for each store, while different colors or patterns within each bar represent the different clothing items. This way, your audience can see the total sales per store and get a sense of the sales distribution among different clothing items.
Multi-Series Charts
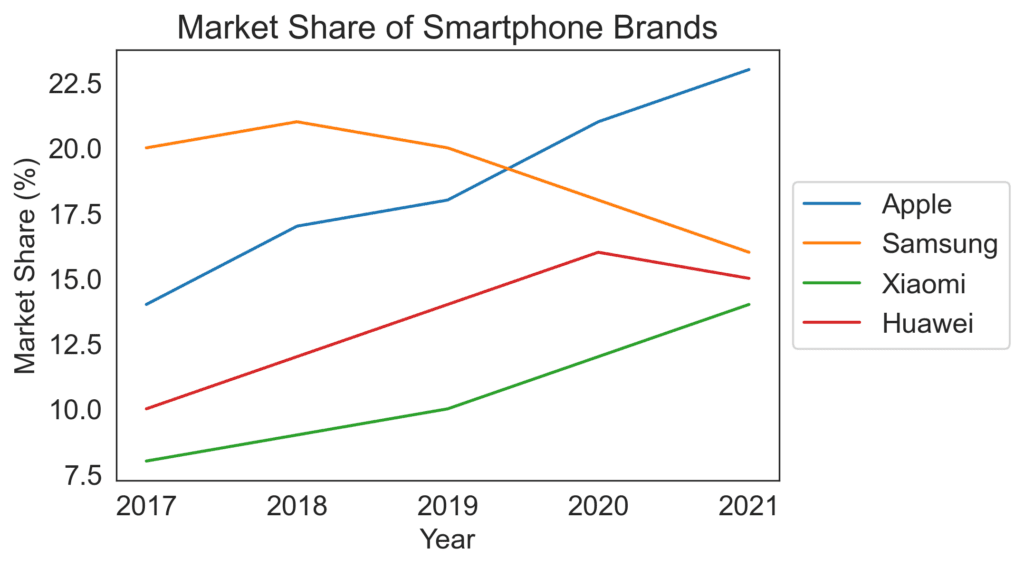
Multi-series charts show the relationship between two or more categories, often using a combination of chart types to display different variables or data elements. They are especially useful when comparing trends or patterns across categories over time.
When analyzing the changes in the market share of different smartphone brands over the past five years, a multi-series line chart can display the market share of each brand by year. Each line represents a smartphone brand; the points correspond to market share in a given year. This visual allows your audience to compare the performance of various brands over time and identify trends or patterns.
While grouped, stacked, and multi-series charts are all valuable tools for displaying categorical-categorical data, understanding the differences in their appearances and purposes helps ensure you convey a more comprehensive and nuanced understanding of the data to your audience.