Highly effective charts can be used for displaying comparisons. The following charts will help you make sense of your data more easily and present your information visually appealingly.
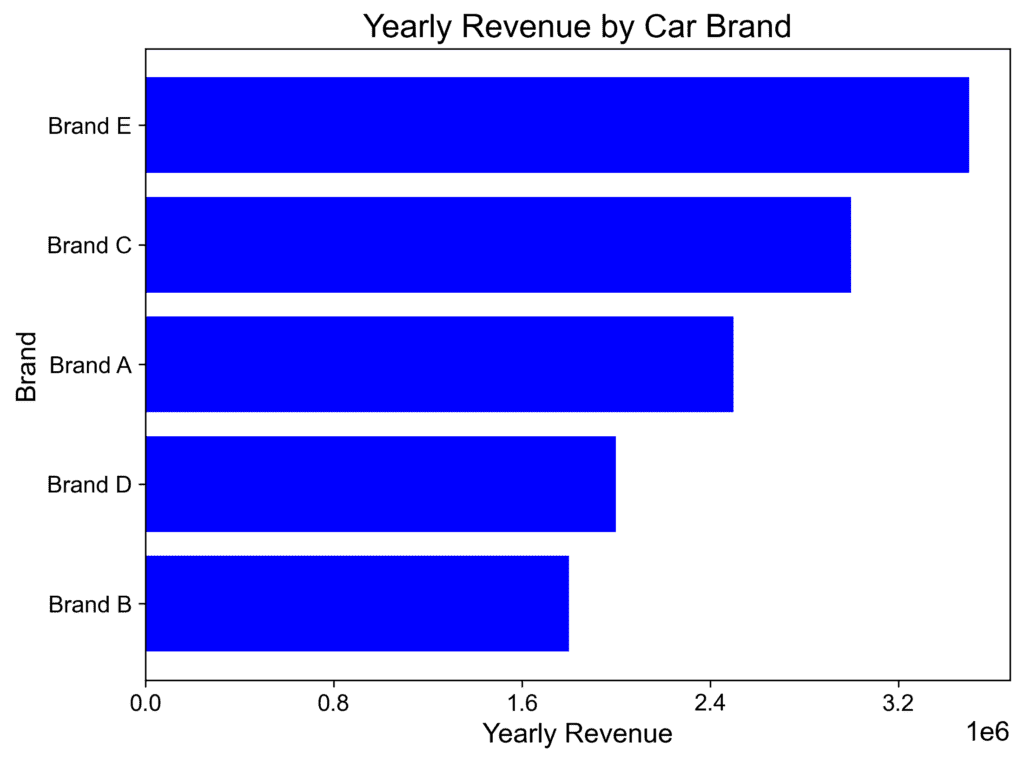
1. Bar charts are one of the most common and effective ways of showing comparisons between categories of data. They have horizontal or vertical bars that represent the values of different categories or groups on a single axis.
For example, imagine we want to compare the yearly revenue of different car brands. A horizontal bar chart can represent each brand’s yearly revenue using bars of varying lengths. This makes it easy for the viewer to understand which brand generated the highest revenue and the relationship between the revenues of each brand.
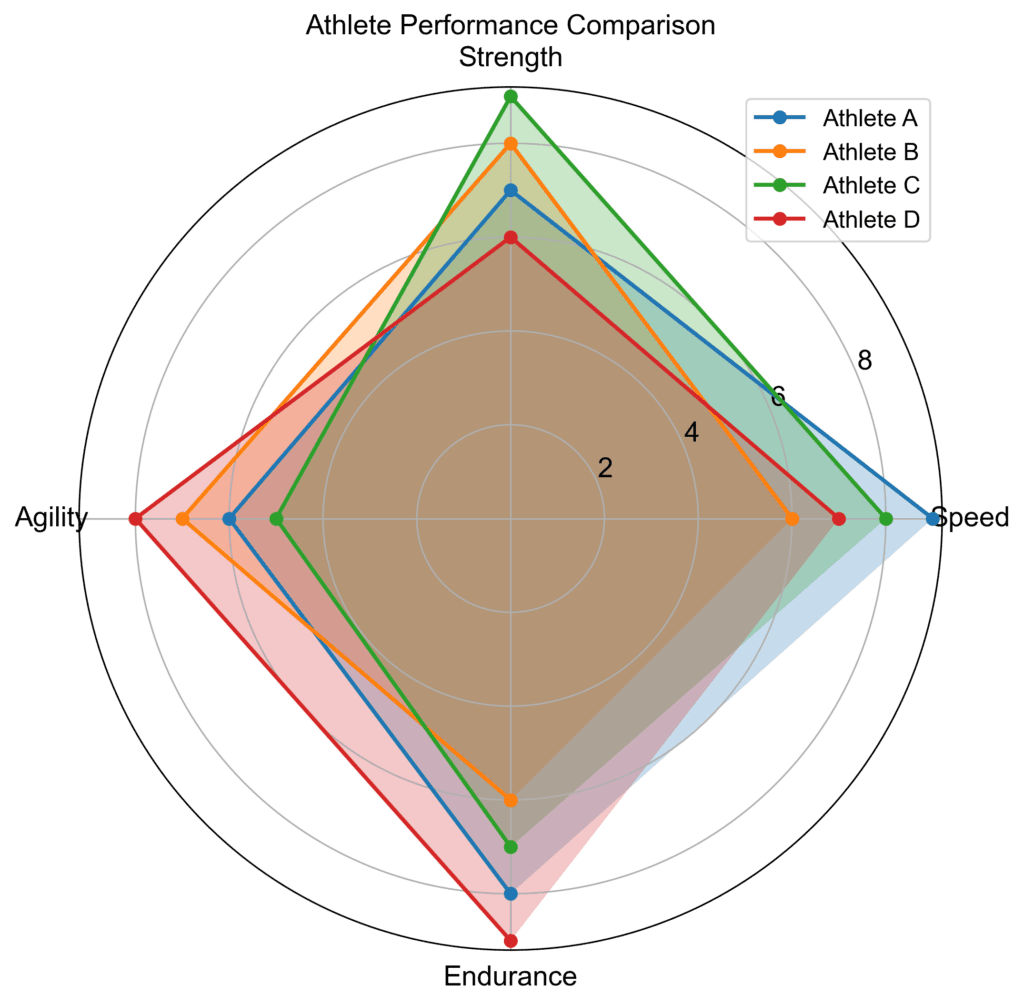
2. Radar charts, or spider charts, are useful for comparing multiple variables (usually 3-7) across different categories or groups. These variables are plotted on separate axes that radiate from a central point and are connected by straight lines.
Consider a scenario where we want to compare the performance of different athletes across various aspects like speed, strength, agility, and endurance. A radar chart will display these attributes on separate axes and connect the axis points for each athlete, creating a shape that shows their overall performance.
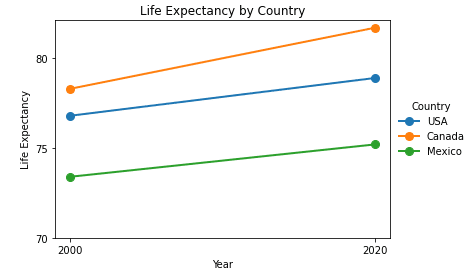
3. Slope graphs are excellent for illustrating changes between two points (such as before and after) across multiple categories. This type of graph plots the data points for two variables on separate axes, with lines connecting the points to represent the rate of change.
For instance, if we want to show how life expectancy has changed in different countries over time, a slope graph would help us visualize the changes. This would show us which countries have had a larger increase over time.
4. Parallel coordinates plots are useful for exploring and comparing multivariate data, identifying correlations, and detecting outliers. They are often used in fields such as engineering, finance, and data science. In a parallel coordinates chart, each variable is represented by a vertical axis, and all the axes are placed parallel to each other. The data points are then represented as a series of connected line segments, with each segment corresponding to a particular data point. The position of each line segment on each axis represents the value of the corresponding variable for that data point. By connecting the line segments for each data point, a pattern or trend can be identified across multiple variables, allowing for a comprehensive analysis of the data.
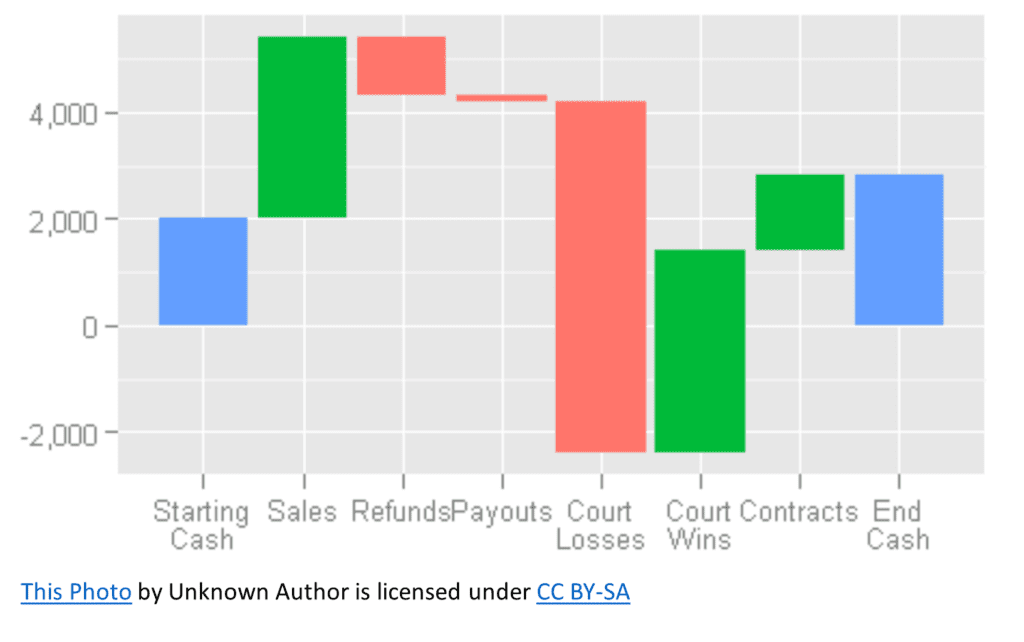
5. Waterfall charts are useful for demonstrating the cumulative effect of sequentially introduced positive or negative values. Often used in finance, these charts help show how an initial value extends to a final value by depicting additions and subtractions in between.
Imagine you want to illustrate how the net profit of a company was impacted by different sources of revenue and expenses. A waterfall chart would start with an initial value, say the gross profit, and then show how various sources of revenue and expenses contribute to the final net profit value.
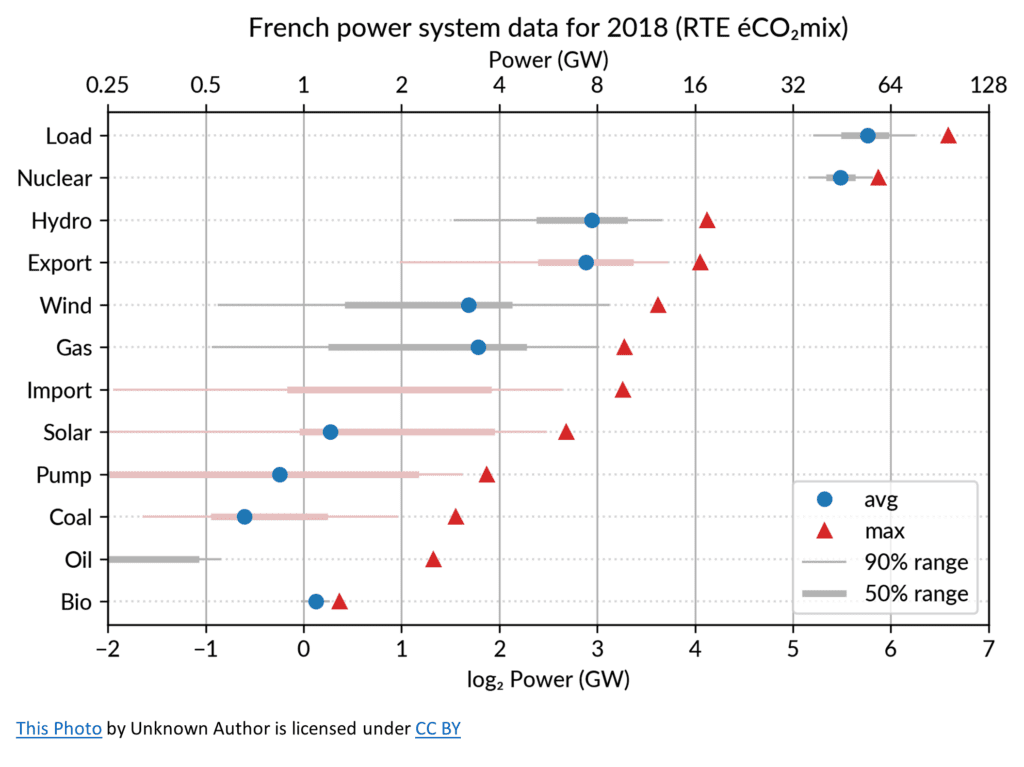
6. Cleveland dot plots effectively display comparisons when there are many data points or when the values fall within a narrow range. These plots show dots distributed across a horizontal axis, where the dot’s position corresponds to the data point’s value.
For instance, if we want to compare the amount of power used by different systems in a single year, a Cleveland dot plot will allow us to easily spot the areas that used the most and least amounts of power.
In conclusion, designing visual information is an art that combines data science with effective communication aesthetics. By understanding the purpose and characteristics of these six types of charts, you’ll be in a better position to create effective visuals that communicate your data and tell your story.