Let’s discuss some essential techniques that will help you transform your data into a format that’s easy to understand and analyze. Techniques presented include pivoting and melting, aggregating and summarizing, and splitting and merging columns.
1) Pivoting and Melting
Think of your dataset as a spreadsheet. You might have a table that looks like this:
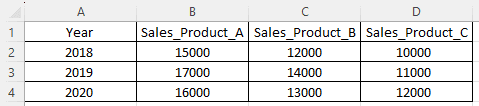
To make it easier to analyze, you might want to change the format so that you have one row per product and year, like this:
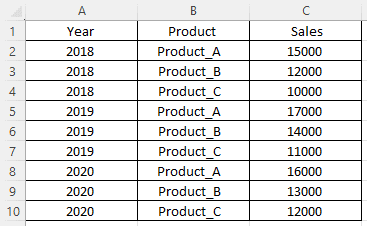
This is called melting the data; software tools can achieve this with just a few clicks. You perform a pivot operation when you need to change your data back to the original format.
2) Aggregating and Summarizing
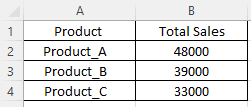
Now that your data is in a more convenient format, you might want to see the total sales per product or per year. To do this, you’ll need to aggregate the data, which means combining rows based on certain criteria and applying a function (like sum, average, or count) to each group. Let’s say you want to find the total sales for each product:
Summarizing is similar to aggregating, but you often derive a single value instead of outputting the results as a new table. For example, you might want to find the overall total sales:
- Overall Total Sales: 120,000
3) Splitting and Merging Columns
Sometimes, the data you have might not be organized in the most helpful way. For example, you might have a column for customer names that looks like this:
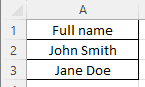
It would be more useful to have separate columns for first and last names, like this:
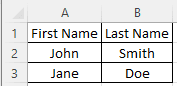
This process of breaking a single column into multiple columns is called splitting. You can often accomplish this using software tools that automatically recognize common patterns, like spaces or special characters, to determine where to split the data.
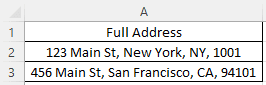
On the other hand, you might find that you have information spread across multiple columns that would be more useful if combined into a single column. In that case, you’d perform a merging operation. For example:
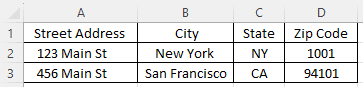
Combined into a single column, it would look like this:
These reshaping techniques will allow you to work with your datasets more effectively