Let’s start with a little scenario that might sound quite familiar. Imagine it’s Saturday morning. You walk down to your favorite coffee shop, greeted by the tantalizing aroma of freshly brewed coffee ☕. You order your usual, and while waiting, you mindlessly pull out your phone and scroll through social media 📱. Your feed is packed with posts – photos, updates, news stories – a data overload. And yet, you swiftly glide through it all, effortlessly, sorting out the significant from the insignificant. But how exactly do you do this? How do you decide which post to pause and which story to dive into? 🤔💬
The answer lies in purpose – the ‘why’ behind each story.
Every day, consciously or not, we’re all sifting through a vast ocean of stories – of data. But not all of it engages us; not all of it sticks. The ones with something in common – a compelling purpose that resonates with us. 💡
And that is precisely what we’re here to delve into – the idea of ‘Purpose in Data Storytelling.’ It’s not some abstract, high-concept topic. It’s something you all do every day, probably without realizing it. You are all data storytellers, and today, we will explore the purpose behind the stories you tell, read, and, most importantly, engage with.
So, as we journey together, I invite you to reflect, question, and understand how defining a data story’s purpose is more than just an intellectual exercise – it’s a fundamental part of our everyday lives that shapes our understanding of the world. Let’s explore purposeful data storytelling and unravel how it affects you, me, and the world.
The Purpose of a Data Story
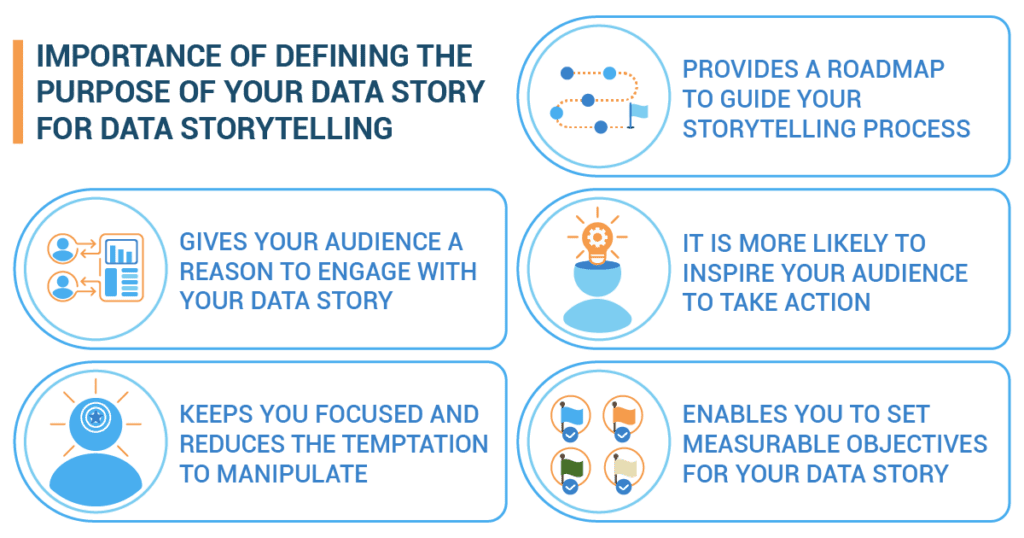
Defining the purpose of your data story provides a roadmap to guide your storytelling process. This helps you decide what data to include, what questions to answer, and how to structure your narrative.
- Think of yourself as a detective, and you’ve just walked into a room filled with clues. To solve the case, you need to sort through the clues and find the ones that help you tell the story of what happened. It’s similar to data storytelling. We can think of each piece of data as a clue to the bigger story we want to tell. The purpose of your data story is like the mystery you’re trying to solve. It guides which clues you pay attention to and how you combine them to solve the case.
A clear purpose gives your audience a reason to engage with your data story. This purpose connects with their interests or needs and motivates them to pay attention and remember your message.
- Imagine solving a mystery without knowing what you’re trying to solve. It would be pretty challenging, right? The same goes for data storytelling. Without a clear purpose, you won’t know which data is important or how to structure your story. It’s like putting together a puzzle without seeing the picture on the box.
When your data story has a clear purpose, it is more likely to inspire your audience to take action. This could range from deciding, changing a behavior, or simply thinking about an issue differently.
- Let’s say you’re presenting to your class about how much time students at your school spend on homework each night. That might not be very exciting if you want to share some facts. But, if your goal is to show that students are spending too much time on homework and not enough time on other important things like exercise or sleep, that’s a story your classmates might be more interested in.
A defined purpose keeps you focused and reduces the temptation to manipulate or misinterpret the data to make it more exciting or compelling.
- Suppose you are conducting a research project in a high school to investigate the relationship between students’ sleep patterns and academic performance. A defined purpose would ensure that you analyze the data objectively, accurately representing the relationship between sleep patterns and academic performance.
With a clear purpose, you can set measurable objectives for your data story. This allows you to evaluate whether your account has achieved its intended goal.
- You analyze student performance data and propose strategies for improving academic achievement. Once you have completed your data story, you can evaluate whether your objectives have been met. If the measurable goals have been achieved or exceeded, it indicates a successful data story that has effectively highlighted the impact of personalized tutoring programs on student academic performance.
Choosing an Objective for Your Data Story
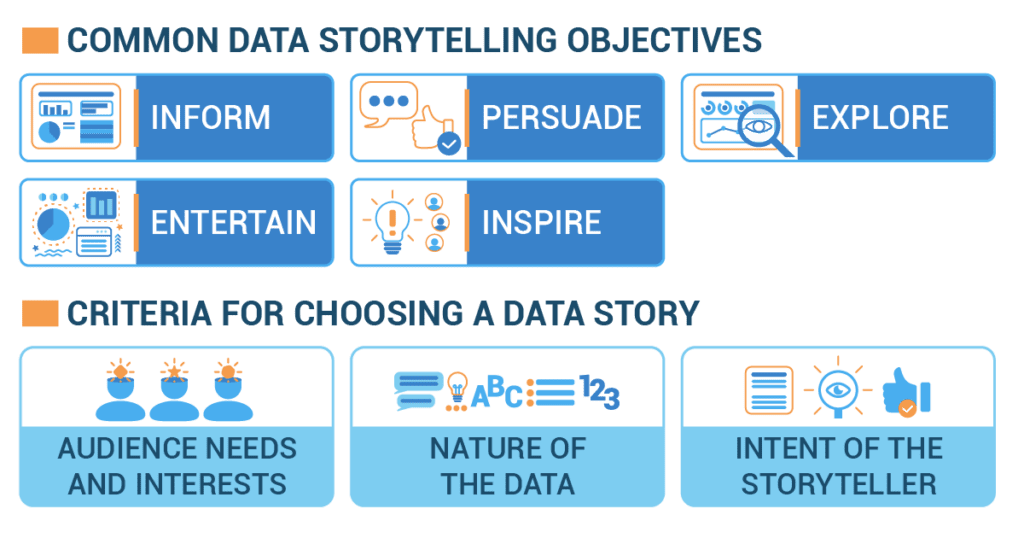
So, how do you choose a purpose for your data story? Here are some common objectives you might consider:
- Inform: Let’s say you’ve just surveyed the favorite sports of students in your school. Your objective might be to inform your classmates about the most popular sports.
This is about educating or informing the audience about a particular issue, event, trend, or phenomenon. It’s typically used when the purpose is to share facts or findings without attempting to elicit a specific action or response. It is essential that your data is accurate, relevant, and comprehensive enough to provide a complete picture of the topic at hand.
- Persuade: Now, imagine you think your school should start a cricket team. You might use data about how many students like cricket to persuade your school’s principal to start a team.
The aim is to convince the audience to accept a particular perspective or to influence their decision-making. You should choose this objective to influence your audience’s opinion or encourage them to take action. In this case, your data must strongly support your argument and appeal to your audience’s values, emotions, or logic.
- Explore: Let’s say you’ve collected data about different countries’ populations and sizes. You might create an interactive map where your classmates can explore the data and draw their conclusions.
These stories present data to encourage the audience to explore and interact with it to draw their conclusions. This is often used in interactive data visualization projects, where the objective is to promote discovery and interpretation. It would be best to have a rich dataset that allows for deep-dive analysis, and your audience should be interested in exploring and understanding complex patterns or trends.
- Entertain: Suppose you’ve got data about the weirdest foods people eat worldwide. Your objective might be entertaining your classmates with fun and surprising facts.
The aim is to engage the audience through interesting data, visualizations, and narratives. The entertainment objective is appropriate if you aim to create an engaging and enjoyable experience for your audience. Your data should lend itself to interesting, surprising, or visually appealing representations.
- Inspire: Imagine you’ve found data showing how recycling can reduce pollution. You might use this data to inspire your classmates to recycle more.
The objective is encouraging the audience to take a specific action or change their behavior. Choose this objective if you want to motivate your audience to take action. Your data should demonstrate the benefits of the activity or the consequences of inaction. Your story should also appeal to your audience’s values or aspirations.
When Choosing Your Objective, Think About the Following:
- Audience needs and interests: Who is the story for? What are their needs, interests, and level of knowledge about the subject?
- Nature of the data: What kind of data do you have, and what does it tell you?
- Intent of the storyteller: Why are you telling this story? Is it to inform, persuade, encourage exploration, or explain something?
Best Practices and Tips for Defining Your Purpose
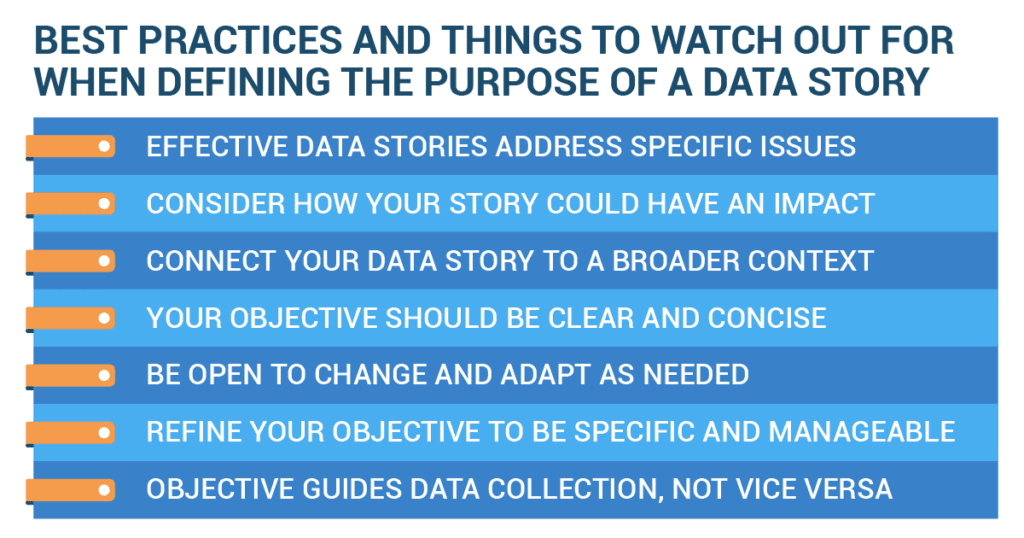
Finally, here are some tips to help you define your purpose:
- Try to solve a problem: Think of your purpose as the mystery you’re trying to solve. This could be a real-world problem like, “How can we reduce food waste in our school?”
- Keep it simple: If your purpose is too complex, you might lose your audience. Make sure it’s something easy to understand.
- Be open to change: As you dig into your data, you might find that your purpose needs to change. That’s okay!
- Be specific: Don’t try to cover too much in one story. Focus on a particular topic.
- Let your purpose guide you: Once you have a purpose, let it show your data collection. You might find that you need more data to tell your story.
And there you have it! Defining the purpose of your data story is like choosing the mystery you want to solve. With a clear purpose, you’ll know which clues to look for and how to put them together to tell an engaging and meaningful story. Good luck, young detectives!
Grading the Grades: Chris’s Journey Through the Maze of Academic Data
 Chris was in a unique position at the start of his junior year. He was selected as the student representative for the school’s academic board, a role that required him to examine the school’s educational data. His mission? To identify areas of improvement that could help his peers excel. Chris was excited but also realized he had an ocean of data at his disposal, and it was easy to get lost. He then understood he needed to define a clear purpose for his data story.
His first step was identifying the most pressing academic issues his peers faced. Through informal conversations and organized focus groups, he discovered two critical areas of concern: the students’ stress levels during final exams and the widespread disconnect with the math curriculum.
With this feedback, Chris focused his data story on these two areas. He defined his purpose: “To explore the correlation between student stress and final exam performance, and to analyze the effectiveness of the current math curriculum in engaging students.” This clear, focused purpose allowed him to concentrate on relevant data and exclude the information that did not serve this purpose.
Chris pulled data on students’ self-reported stress levels during final exams to address the first part of his purpose and compared this to their performance. To make sense of the math curriculum disconnect, he compared student engagement levels in math classes with other subjects, using data such as attendance records, grades, and feedback from student surveys.
As Chris dove into the data, his purpose served as a compass, guiding his analysis and helping him decide which data points were relevant. He wasn’t tempted to venture into other intriguing but irrelevant areas like the relation between sports activities and grades or the effects of school starting times on attendance.
Finally, Chris presented his findings to the academic board. He kept his presentation focused on his purpose, clarifying why his peers found the final exams particularly stressful and how the math curriculum failed to engage them. The board was not just informed but was persuaded to take immediate action. They explored ways to manage exam-related stress and re-evaluate the math curriculum, making Chris’s data storytelling endeavor a resounding success.
In defining his purpose, Chris turned a complex sea of data into a compelling story, leading to change and improvements for his fellow students. His journey exemplifies how a clear purpose can illuminate the path through the densest data forests.