Have you ever wondered how researchers gather information to solve problems and make discoveries? Well, get ready to become data detectives as we uncover the secrets of surveys, interviews, observation checklists, data logs, experiments, and secondary data sources.
Types of Data Collection Tools
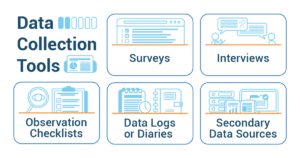
In the world of research and analysis, the tools we use to gather data are critical in shaping our understanding and insights. From surveys to interviews, each tool offers a unique lens to view and interpret the world around us.
Surveys, like questionnaires that can gather all kinds of information
Imagine you want to know what your fellow high school students like and don’t like. A survey could help you gather data on their interests, favorite subjects, or hobbies. You could even ask about their opinions on school policies or their thoughts on current events. Surveys are powerful tools for understanding people, places, and ideas!
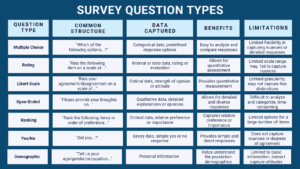
- Benefits: Surveys let us gather information from many people quickly. We can compare the answers easily and learn about a lot of different things.
- Limitations: Sometimes, people don’t answer surveys honestly, so the information may not be completely accurate. Surveys also don’t always give us detailed or personal explanations.
Interviews, where you become a curious investigator
Sometimes, you might have a list of questions ready (structured interview), like asking your classmates about their study habits. Other times, you might just chat and ask whatever questions come up (unstructured interview). Interviews provide detailed, in-depth, qualitative data, especially when exploring complex or sensitive topics.
- Benefits: Interviews let us have detailed conversations with people to learn more about their thoughts and experiences. We can ask follow-up questions and get a deeper understanding.
- Limitations: Interviews take a lot of time and effort. Sometimes, people might not tell the whole truth, and it may be hard to interview a large number of people.
Observation checklists, where you become a keen observer
Imagine you want to study the behavior of students during lunchtime. You can use an observation checklist to note if they are eating, talking, or playing games. Observation checklists help you systematically record the presence or absence of behaviors or phenomena. It’s like being a silent observer, discovering patterns and gathering valuable data.
- Benefits: Using checklists helps us keep track of specific things we want to observe. It helps us be organized and compare our observations. We can see patterns or behaviors more easily.
- Limitations: Checklists may not show us everything. We might miss important details or things that happen outside of what we’re observing. People doing the observations might have different opinions or miss things, too.
Data logs or diaries, tools to record events over time
Imagine keeping a diary of your daily screen time for a week or recording your exercise routine. Data logs allow you to see changes, patterns, or trends over a period—an incredible way to understand how things evolve. In some cases, special tools or computer programs are needed to collect data, especially in experiments. Think of a scientist using a microscope to study cells or a physics student measuring the speed of objects using sensors. These tools ensure precise data collection, enhancing the accuracy of our statistical studies.
- Benefits: Data logs let us record information as it happens, which can give us accurate and detailed data. We can see patterns over time and learn about people’s habits or actions.
- Limitations: Keeping a data log can be a lot of work and might take up time. Sometimes, people might forget to record things or not record them accurately. We might not get the full picture of what’s happening.
Secondary data sources
These are existing databases, administrative records, or previously conducted studies. Imagine you are researching the impact of music on concentration, and you find a study that already collected data on this topic. Instead of starting from scratch, you can utilize the existing data and save time. Secondary data sources are like treasure troves of information waiting to be discovered!
- Benefits: Secondary sources give us access to information that’s already been collected by others. We can learn from different sources and compare things easily. It can save us time and give us a broader view.
- Limitations: We can’t always control how the information was collected, so it might not be exactly what we need. Sometimes, the data is old or not completely accurate. We might also miss out on getting more specific or personal information.
How to Write Effective Survey Questions
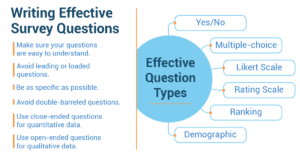
Now that we’ve explored various data collection tools, let’s learn how to craft effective survey questions. Remember, the way you ask questions greatly influences the quality of the data you collect. Here are some tips for creating clear and reliable questions:
- Keep it simple: Avoid using big words or confusing sentences. Make sure everyone can easily understand your questions.
- Stay neutral: Avoid leading or loaded questions that push people to answer a certain way. Leading: “Do you agree that our new product is the best on the market?” Loaded: “Don’t you think it’s unfair that some people receive special privileges while others are left with nothing?” Keep your questions unbiased and open to different perspectives.
- Be specific: Make your questions clear and direct so respondents know exactly what you’re asking.
- Avoid double-barreled questions: Asking two things in one question can confuse respondents and lead to inaccurate responses. Stick to one topic at a time; if “and” appears in a survey question, it is very likely to be a double-barreled question.
Common Biases that Can Sneak Into Data Collection and Learn How to Avoid Them
Now that we have introduced these tools, it is important to understand how to use them for good and not evil. So, let’s talk about biases. Now, you might be wondering, “Biases in statistics? I don’t know anything about that!” The truth is, we encounter biases more often than we realize – from choosing the perfect outfit that flatters us most to selecting the most reliable route to school. It is important to name some common biases and how to avoid them.
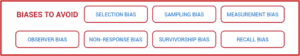
- Sampling bias: Beware of the slice size! Sampling bias happens when your ‘slice’ (sample) of the population you’re studying is too small or not chosen randomly. To avoid this bias, strive for a big and varied sample, making sure to choose participants randomly. This way, your data represents the whole population accurately.
- Selection bias: Oops, favoritism alert! Selection bias, a type of sampling bias, occurs when certain individuals aren’t given an equal chance to be part of the study or when some groups aren’t represented enough. To beat this bias, use techniques like ‘random sampling,’ where you pull names out of a hat, or ‘stratified sampling’ when you’re particularly interested in specific groups. These methods ensure fairness and prevent favoritism.
- Measurement bias: Faulty tools, faulty results! Measurement bias occurs when the tools or methods used to collect data are faulty or biased, leading to skewed results. To avoid this, double-check your tools and methods, such as the self-selection of the sample, for any faults or biases. Ensure that they are reliable, accurate, and neutral.
- Observer bias: Watch out for the Hawthorne effect! Observer bias happens when people know they are being observed and change their behavior as a result. Sneak past this bias by keeping data collection anonymous. When participants don’t know when they’re being watched, they will act naturally, ensuring unbiased results.
- Non-response bias: Everyone counts! Non-response bias creeps in when some individuals chosen for the study don’t want to or can’t participate. To overcome this, offer interesting rewards for participation, assure everyone that their responses will be kept secret (anonymous), and kindly remind those who forget to respond. Everyone’s voice matters!
- Survivorship bias: Don’t forget the whole story! Survivorship bias occurs when a study focuses only on the ‘winners’ or ‘survivors’ of a process, ignoring those who didn’t make it. Avoid this trap by including everyone, not just the ‘winners,’ in your study. This way, you gain a comprehensive understanding of the entire process.
- Recall bias: Memories can be tricky! Recall bias happens when a study relies on people’s memory, which can be faulty. To sidestep this bias, use reliable tools to measure recall or compare information with other trustworthy sources. This way, you ensure accurate data without relying solely on memory.
Case Study: Designing Data Collection Tools for a Statistical Study on Music
 Alex has a special project where he wants to learn about the music choices of other students. To do this, he needs to collect data using some tools. Here’s how Alex designed his data collection tools.
Alex decided to use a questionnaire with simple questions to find out what types of music people like, their favorite artists, and how often they listen to music. The questions are easy to understand. For example:
- What kind of music do you like the most?
- Who is your favorite music artist?
- How often do you listen to music? (Choose one: Every day, Many times a week, Once a week, Not often)
- Where do you usually listen to music? (Choose one: Online, Radio, CDs, Vinyl, Other)
In order to know how much people like different parts of music, Alex made a scale from 1 to 5 to show how much they agree or disagree. People can say if they strongly agree or disagree with statements about music. Here are some examples:
- I think the words in a song are important.
- I pay attention to the tune when I listen to music.
- The beat of a song affects how much I like it.
- Music makes me feel strong emotions.
Alex also created a log where people can write down the music they listen to each day for a week. They can write the date, time, type of music, artist, and how they listen to it. This will help Alex understand what music people listen to regularly.
By using these tools—a questionnaire, rating scale, and music log—Alex will learn a lot about people’s music preferences. The questionnaire will give general information, the rating scale will show how much people like different aspects of music, and the music log will give specific details about what they listen to.
Alex is excited to use these tools to collect data and learn interesting things about the music choices of other students.