Imagine yourself standing in the grocery store 🛒 in front of the overwhelming cereal aisle. Each box promises you something – fiber, vitamins, sugar, flavor, and the list is endless. Each box presents a claim. And in that moment, without even realizing it, you’re running a statistical test. You are deciding whether you believe the claim that the “All-Natural Superfood Granola” will really make you feel energized 💪, or whether the “Frosted Sugar Bombs” are truly ‘part of a balanced breakfast’ 🥣.
In our everyday lives, we are constantly surrounded by claims – in advertising, on social media, in news reports – and we decide whether we believe them or not, often based on some set of evidence, even if we don’t consciously realize it.
But how do we validate these claims in a scientific or research context? That’s where statistical tests come into play. They provide us with a formal, structured way to evaluate the evidence and either support or refute a claim.
Statistical Tests
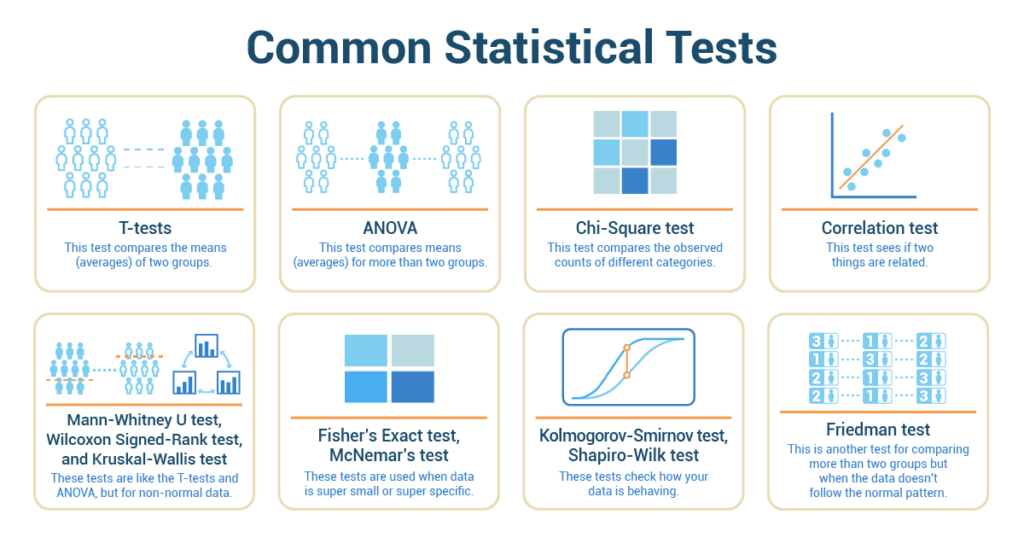
Statistical tests are like detective tools. They help us find clues and make sense of numbers and data. They’re kind of like your math superpowers. Here are some tests we’re going to talk about:
- T-tests: This test compares the means (averages) of two groups. Imagine trying to find out whether the average homework time is different for 9th graders and 10th graders.
- ANOVA: Sounds like a star, right? But it actually compares means for more than two groups. Let’s say you want to compare the average test scores of freshmen, sophomores, juniors, and seniors.
- Chi-Square test: This test is about categories. Like checking if there’s a connection between favorite school subjects and grades.
- Correlation test: This test sees if two continuous variables are related. For example, does the amount of time you spend studying affect your test score?
- Mann-Whitney U test, Wilcoxon Signed-Rank test, and Kruskal-Wallis test: These tests are like the T-tests and ANOVA, but for non-normally distributed data. They’re used when data doesn’t behave as expected, sort of like a wild house party when parents are out of town!
- Fisher’s Exact test, McNemar’s test: These are used when data is super small or super specific. Like comparing the number of students who prefer chocolate ice cream to those who prefer vanilla in your class.
- Kolmogorov-Smirnov test, Shapiro-Wilk test: These tests check how your data is behaving. Is it normally distributed like a bell curve, or is it a little unusual?
- Friedman test: This is another test for comparing more than two groups, but when the data doesn’t follow the normal pattern.
How to Pick the Right Test
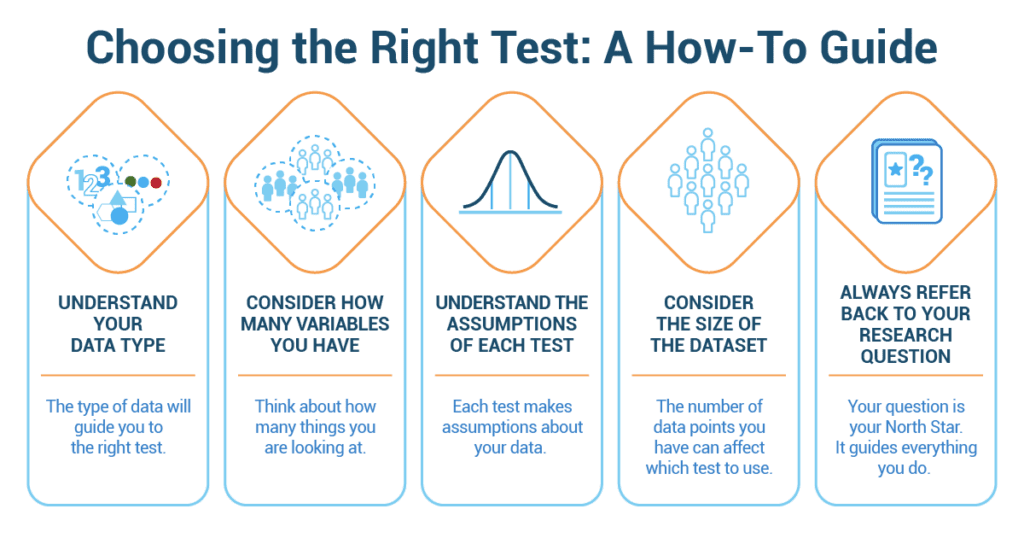
Choosing the right statistical test can feel like choosing a book to read. There are so many options, and each one has a different story to tell! Here’s a handy guide:
- Understand your data type: Look at your data. Is it continuous (like time or weight) or categorical (like favorite color or type of pet)? The type of data will guide you to the right test.
- Consider how many variables you have: Think about how many things you are looking at. Is it one group or two? Or more?
- Understand the assumptions of each test: Each test makes assumptions about your data. Like whether the data follows a bell curve, or if every observation is independent. It’s like checking if you have the right ingredients before you start baking.
- Consider the size of the dataset: The number of data points you have can affect which test to use. Some tests work better with larger groups, and others with smaller ones.
- Always refer back to your research question: Your question is your North Star. It guides everything you do. Make sure your test answers your question!
The Key to Success: A Musical Case Study
 Alex has always been captivated by music. From the rhythmic drumbeats that pulse through pop songs to the soulful strumming of acoustic guitars in folk ballads, he’s intrigued by it all. But more recently, his fascination had taken a turn towards the analytical. A keen student of statistics, Alex began to wonder, “Do people have a favorite key in music? Does the key of a song influence how much people like it?”
To answer this question, Alex decided to conduct a study. He selected a popular music streaming platform and accessed their API to gather data on the top 100 songs from different genres. For each song, he collected the key and the number of times the song was streamed. He hypothesized that songs in a particular key might have more streams compared to songs in other keys.
Now, he had to decide how to analyze the data. He knew he had to select an appropriate statistical test to determine if there was a relationship between the key of a song and its popularity.
As Alex reviewed his statistics notes, he remembered learning about ANOVA (Analysis of Variance), a type of statistical test used to compare the means of three or more groups. In this case, the key of a song would be the independent variable with multiple categories, and the popularity of the song (based on stream counts) would be the dependent variable. It seemed like the perfect fit.
With this insight, Alex proceeded with his ANOVA test. He performed the calculations, checked his assumptions, and came up with a p-value – a measure of the strength of evidence against his hypothesis. If the p-value was low, it would suggest that the key of a song could indeed influence its popularity.
But we’ll have to leave the exact outcome of Alex’s analysis for another day. What’s important here is the process, the logic behind Alex’s selection of the ANOVA test. Just like Alex, when faced with a claim or a question, our task is to carefully consider the type of data we have and the nature of the question we’re trying to answer before selecting the right statistical test to get us to the truth. Because in the end, the pursuit of truth – be it in a cereal box, a song, or a research paper – is what statistics, and indeed all of science, is all about.