Today, we’re going to learn how to filter data in spreadsheets based on specific criteria. This is a super important skill to have, especially in the business world, because it helps you quickly find and analyze the data you need.
Imagine you’re a sales manager with a long list of transactions. You might want to filter this data to see only the sales made by a specific salesperson or only those sales above a certain amount. Let’s dive right in and see how this can be done using a simple and practical example.
For our tutorial, we’ll be using a sample dataset containing information about product sales, including columns like “Product Name,” “Salesperson,” “Price,” and “Quantity Sold.”
| Product Name | Salesperson | Price | Quantity Sold |
| Product A | John | 5.99 | 5 |
| Product B | Jane | 10.99 | 10 |
| Product C | John | 20.99 | 3 |
| Product D | Sarah | 15.99 | 7 |
| Product E | Jane | 8.99 | 12 |
Here’s how you can filter this data:
- Select your data range: First, click on any cell within your dataset. This helps the spreadsheet program identify the range of data you want to work with.
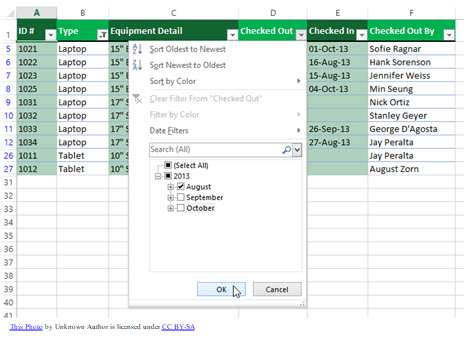
- Activate the filter: In most spreadsheet programs, like Microsoft Excel or Google Sheets, you’ll find the filter feature under the “Data” tab in the toolbar. Click on the “Data” tab, and then click on the “Filter” or “Create a Filter” button. You’ll now see drop-down arrows next to each column header in your dataset.
- Apply your filter criteria: Click on the drop-down arrow next to the column you want to filter. For example, let’s say we want to see only the sales made by a salesperson named “John.” We’d click on the drop-down arrow next to the “Salesperson” column, and a list of all unique salespeople in the dataset will appear. Uncheck “Select All” and then select “John” from the list. Click “OK” or “Apply” to apply the filter.
 Voila! Your data is now filtered to show only the sales made by John. You’ll notice that the other rows are hidden, but don’t worry – they’re still there, just temporarily hidden from view.
 - Filter by multiple criteria: If you want to filter your data by multiple criteria, simply repeat the steps above for each additional column. For example, let’s say we want to see only the sales made by John for products priced above $10. We’d click on the drop-down arrow next to the “Price” column, select “Number Filters” or “Filter by Condition,” and choose the “Greater than” option. Then, we’d type “10” into the box and click “OK” or “Apply.” Now, our data is filtered to show only the sales made by John for products priced above $10. You can apply as many filters as you need to find the data you’re looking for!
- Clearing your filters: To clear your filters and see your entire dataset again, simply click on the drop-down arrow in the filtered column(s) and choose “Clear Filter” or “Select All.” Your data will reappear, just like magic!
Bonus: Sorting Data with Filter Drop-Downs
Sorting data can be incredibly helpful when you want to organize your dataset in a specific order, like alphabetically or numerically. Luckily, you can use the filter drop-downs to easily sort your data. Let’s see how this can be done using our sample dataset:
- Sort by a single column: To sort your data based on a single column, click on the drop-down arrow next to the column header. For example, if we want to sort our data alphabetically by the “Salesperson” column, we’d click on the drop-down arrow next to “Salesperson.” Then, select “Sort A-Z” to sort the data alphabetically or “Sort Z-A” to sort it in reverse alphabetical order. For numerical columns, you can choose “Sort Smallest to Largest” or “Sort Largest to Smallest.”
- Sort by multiple columns: If you want to sort your data based on multiple columns, you can do this by applying the sorting sequentially. For instance, let’s say we want to sort our data first by the salesperson’s name (alphabetically) and then by the price (from highest to lowest). We’d first sort by “Salesperson” (A-Z), and then click on the drop-down arrow next to “Price” and choose “Sort Largest to Smallest.”
Now, our dataset is sorted first by salesperson name and then by price. This is a great way to organize your data, making it easier to analyze and interpret.
That’s it! Now, you know how to filter data based on specific criteria. This skill will help you quickly and efficiently analyze large datasets in the business world.