Hey guys! It’s Chip, and I’m here to discuss selecting charts to explore univariate distributions! 📊
When it comes to selecting charts to explore univariate distributions, there are a few things to consider. We’ll talk about some of the most important factors to keep in mind.
🔍 Type of data: The type of data you have is an important factor to consider when choosing a chart. For example, if you have categorical data (data that falls into categories), a bar chart might be a good choice. On the other hand, if you have numerical data (data that can be measured), a histogram or boxplot might be a better choice.
🔍 Size of dataset: The size of your dataset can also influence your choice of chart. If you have a small dataset, a stem-and-leaf plot or dot plot might be appropriate. If you have a larger dataset, a histogram or boxplot might be a better choice.
🔍 Ability to explore broad patterns vs details: Some charts are better at showing broad patterns in the data, while others are better at showing individual values. For example, a histogram is good at showing the general shape of the data, while a stem-and-leaf plot or dot plot is better at showing individual values.
🔍 Ability to reveal outliers: Finally, the ability to reveal outliers is an important factor to consider. Some charts, like boxplots, are designed specifically to highlight outliers in the data. Others, like histograms, can be used to identify outliers, but it’s not their primary purpose.
Now, let’s talk about some of the most common charts used to explore univariate distributions and how they compare.
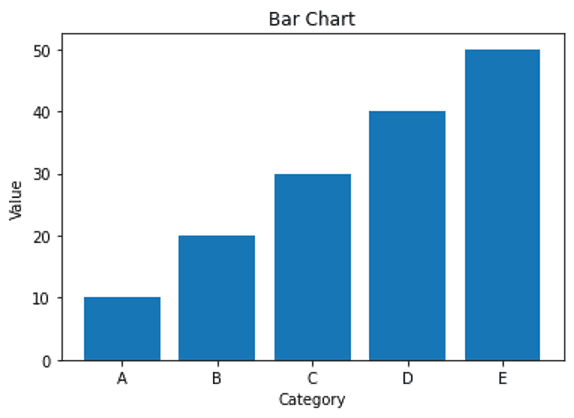
📊 Bar chart: A bar chart is a good choice for exploring categorical data. It shows the frequency of each category and can be used to compare the frequency of different categories.
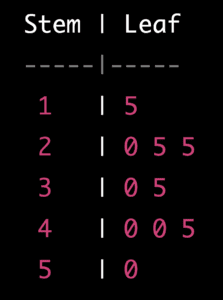
Stem-and-Leaf Plot
Dot Plot
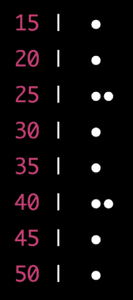
🌱 Stem-and-leaf plot and dot plot: Stem-and-leaf plots and dot plots are good choices for small datasets. They show the individual values in the dataset and can be used to identify outliers.

📈 Histogram and density curve: Histograms and density curves are good choices for exploring numerical data. They show the shape of the distribution and can be used to identify outliers.
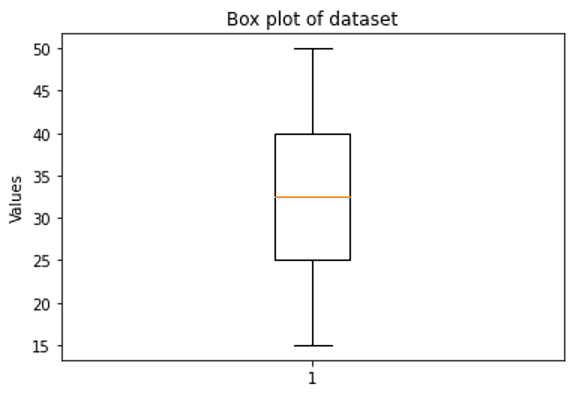
📦 Boxplot: Boxplots are good choices for exploring numerical data. They show the middle 50% of the data, the minimum and maximum values, and any outliers. They are especially good for identifying outliers in the data.
So there you have it! When choosing a chart to explore univariate distributions, consider the type of data, the size of the dataset, the ability to explore broad patterns vs details, and the ability to reveal outliers. Each chart has its own strengths and weaknesses, so choose the one that best fits your needs! 🧐