Dashboard Guide: APIs
Application Programming Interface (APIs) allow you to pull in data and create a dynamic, data-driven dashboard that updates in real-time. Let’s assume we’re working with a business case where we need to display the latest stock market information for a specific company. We’ll use a popular stock market API called Alpha Vantage for this example.
- Obtain an API Key: Before you can access the data from the API, you’ll need to sign up for an API key. Head over to the Alpha Vantage website (https://www.alphavantage.co/) and sign up for a free API key.
- Choose your dashboard development platform: There are several dashboard development platforms available, such as Tableau, Power BI, and Google Data Studio. We’ll use Google Data Studio for this tutorial, as it’s free and easy to use. Feel free to use any other platform you’re comfortable with.
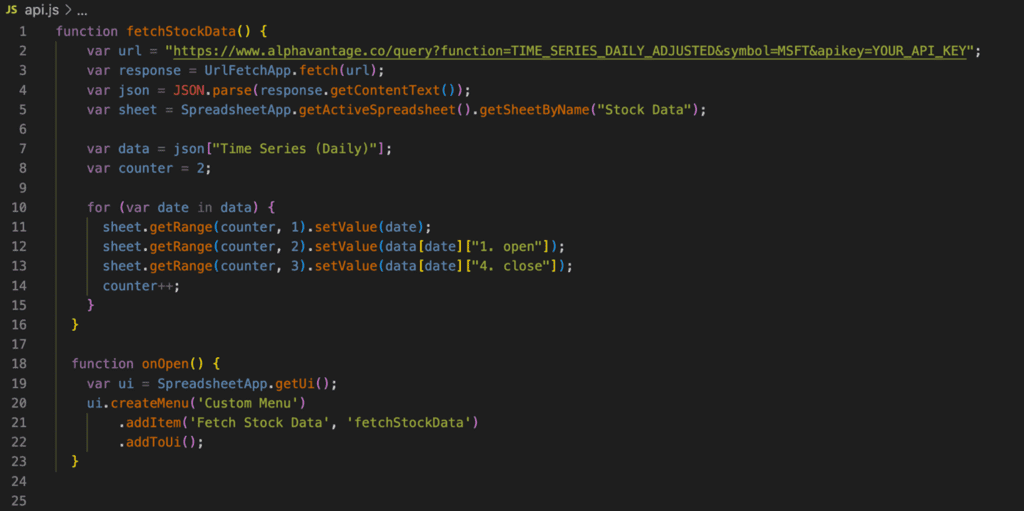
- Connect to the API: To connect to the API, you’ll need to make an HTTP request. Google Data Studio doesn’t have native support for making API calls, but you can use Google Sheets as an intermediary to fetch data from the API and then feed it to your dashboard. In a new Google Sheet, open the Script Editor (Extensions > Apps Script) and paste the following code, replacing “YOUR_API_KEY” with the actual API key you received from Alpha Vantage:
 Save the script and refresh your Google Sheet. You should now see a new “Custom Menu” in the menu bar. Click on it and select “Fetch Stock Data” to populate the sheet with stock market data.
 - Connect your dashboard to the Google Sheet: In Google Data Studio, create a new report, and select “Google Sheets” as a data source. Choose the Google Sheet you just created, and select the “Stock Data” tab. Click “Connect” to load the data into your dashboard.
- Visualize the data: Now that your dashboard is connected to the Google Sheets, you can start building visualizations with the stock market data. For example, you can create a line chart to display the stock’s opening and closing prices over time. Drag and drop the appropriate visualization components onto your dashboard and configure them to use the fields from your Google Sheets.
- Automate data updates: To ensure that your dashboard is always displaying the latest data, you can set up a trigger in the Google Sheets script editor to automatically fetch new data from the API at regular intervals. In the script editor, click on the clock icon (Triggers) and create a new trigger with the desired update frequency, such as every hour or every day. By following these steps, you’ve successfully built a dashboard that pulls in data from an API. With this foundation, you can create more advanced visualizations and explore additional APIs to enrich your dashboard with even more valuable insights. Keep in mind that some APIs have usage limitations, so be sure to review the documentation and respect the terms of service.