When it comes to identifying patterns in a distribution, a histogram can be quicker than a frequency table.
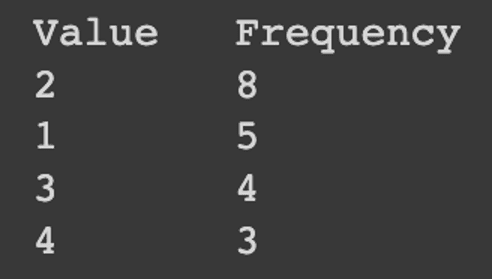
A frequency table shows how many times each value appears in a dataset. It’s a useful way to organize and summarize data. However, it can be harder to see patterns in the data just by looking at a frequency table.
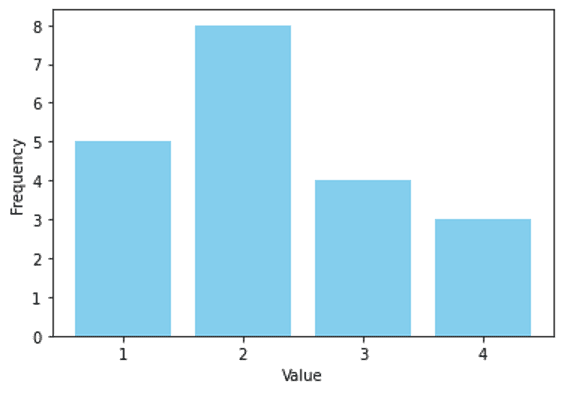
Conversely, a histogram shows the frequency of each value in a dataset using bars. Each bar represents a range of values, and the height of the bar represents the frequency of values in that range. This can make it easier to see patterns in the data, such as if the data is evenly distributed or skewed to one side.
So, while both a frequency table and a histogram can be useful for understanding data, a histogram can be quicker for identifying patterns in a distribution.