Power BI has many analytical features that can help us visualize our data and make better decisions based on the insights we gather. Here are some key analytical capabilities and how they relate to business scenarios.
Data Ingestion and Transformation
First and foremost, Power BI allows you to easily connect to various data sources, such as Excel workbooks, SQL databases, or cloud services, and then clean and transform that data. This is crucial as the raw data we collect is often incomplete or not in the ideal format for analysis.
Consider a sales manager collecting monthly sales data from different regions. Using Power BI’s data transformation capabilities, she can quickly consolidate and clean the data from different regional spreadsheets into a single dataset, making it easier to analyze the overall performance.
Data Modeling and Relationships
Power BI provides powerful data modeling capabilities that allow you to establish relationships between different datasets, add calculated columns, and define new measures or formulas. By doing so, you can create meaningful insights from your data.
In our sales example, the sales manager may want to analyze sales performance per salesperson or per product category. By connecting different datasets and establishing relationships, she can create a powerful data model that allows her and her team to understand the different aspects of their sales performance.
Visualization and Interaction
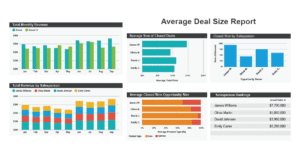
Power BI excels in data visualization, offering a wide array of interactive charts, graphs, and maps. Additionally, it has smart defaults leading to effective dashboard designs, and you can easily customize these as needed.
Our sales manager can create a dashboard to monitor her team’s Key Performance Indicators (KPIs), such as total monthly revenue, average deal size, and salesperson rankings. The interactive visualizations allow her to quickly see trends, outliers, or areas that need improvement.
Advanced Analytics and AI
Power BI offers advanced tools, such as DAX (Data Analysis Expressions) language, and AI capabilities, like anomaly detection or forecasting, that enable deeper analysis of the data.
Imagine our sales manager needs to make predictions about the upcoming quarters. She can use Power BI’s built-in forecasting capabilities and analyze historical data to make predictions. This can then help her make informed decisions about staffing, marketing, and inventory management.
Collaboration and Sharing
Power BI allows for the easy sharing of dashboards and reports with colleagues and stakeholders within and outside the organization. This enables a culture of data-driven decision-making across the entire team or organization.
Our sales manager can share her dashboard with her team members, allowing them to access up-to-date insights about their performance and enabling them to make informed decisions based on the data.
Power BI’s analytical capabilities provide a comprehensive solution for businesses to leverage their data effectively. It offers a powerful platform for making data-driven decisions, from data ingestion and transformation to advanced analytics and collaboration. By mastering these capabilities, you and your team can make better decisions and drive performance in your organization. So, let’s dive into Power BI and bring data-driven decision-making to life!