Have you ever wondered if your team is truly the best in the league? Or maybe asked yourself if your favorite chocolate really is the most loved one in your friend group? Or even pondered whether that last diet fad was genuinely effective or just another baseless claim? We constantly find ourselves trying to make sense of the world around us, trying to identify patterns and connections, asking questions, and seeking answers.
Performing a Statistical Test
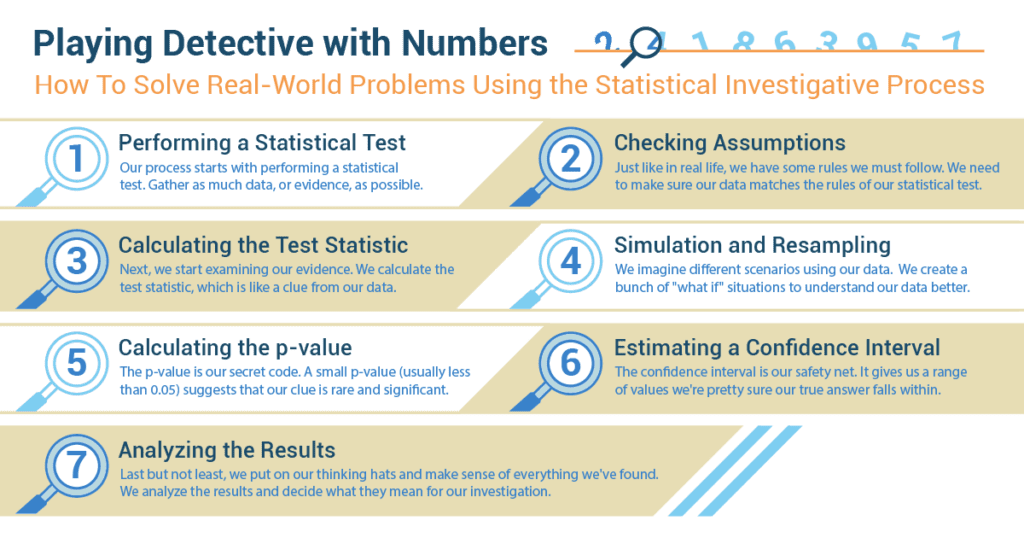
Imagine being a detective. But instead of clues, we’re looking at numbers. Our process starts with performing a statistical test. Think of this as starting a new detective case. You’d want to gather as much data, or evidence, as possible.
Step 1: Checking Assumptions
Just like in real life, we have some rules we must follow. We need to make sure our data matches the rules of our statistical test. For example, if we’re investigating whether men in their 30s and 40s in our office spend the same amount of time working out, our rules may include:
- The data is about time spent on working out.
- We include men in their 30s and 40s.
- All responses are honest and clear.
Step 4: Calculating the p-value
The p-value is the secret code that tells us how surprising our clue (or test statistic) is. A small p-value (usually less than 0.05) suggests that our clue is rare and significant. It’s like finding a hidden treasure map in a detective case.
Step 5: Estimating a Confidence Interval
The confidence interval is our safety net. It gives us a range of values we’re pretty sure our true answer falls within. It’s like knowing our suspect is hiding somewhere within a certain city block.
Step 6: Analyzing the Results
Last but not least, we put on our thinking hats and make sense of everything we’ve found. We analyze the results and decide what they mean for our investigation.
Optimizing Workspace Design Through Spatial Analysis
In the bustling metropolis of Urbanville, a prestigious architecture firm named “DesignScape” was renowned for its innovative approach to creating functional and aesthetically pleasing workspaces. However, a challenge arose when employees began expressing concerns about the effectiveness of the workspace layout on their productivity and well-being. Emily Hernandez, the Lead Architect, found herself diving into the world of spatial analysis, aiming to address these concerns and optimize workspace design.
Emily was a visionary architect with a keen eye for detail. The challenge of creating workspaces that both inspired creativity and promoted productivity had always driven her. The concerns raised by employees highlighted the need for a data-driven approach to workspace optimization. Employees were experiencing discomfort and inefficiencies in the workspace layout. Emily recognized the importance of addressing these concerns to ensure a positive work environment. To do so, she decided to employ spatial analysis techniques to assess the current workspace design’s impact on employee satisfaction and productivity.
In a meeting with her design team, Emily introduced the concept of spatial analysis. She likened it to solving a complex puzzle. Just as every piece of a puzzle contributes to the overall picture, spatial analysis examines how various elements within a space – layout, furniture arrangement, lighting, etc. – interact to influence the occupants’ experience. Emily identified the need to correlate specific spatial features with employee satisfaction and productivity. After consultation with her data analytics team, they decided that a correlation analysis would be appropriate. This statistical technique would help identify any relationships between different spatial factors and employee experiences.
To proceed, Emily’s team gathered data from employee surveys that had been conducted regarding their workspace experiences. The surveys included questions about factors such as comfort, lighting, noise levels, and overall satisfaction. With the data compiled, Emily’s team ran a correlation analysis to determine if there were statistically significant relationships between the various spatial factors and employee satisfaction and productivity.
When the results were in, Emily studied the correlation coefficients and their associated p-values. She looked for strong correlations that indicated a clear connection between a specific spatial feature and employee satisfaction or productivity. Upon discovering significant correlations, Emily and her team began making design recommendations based on the findings. For example, they identified that employees who had access to natural light were generally more satisfied and productive. As a result, they recommended reconfiguring the workspace layout to maximize exposure to natural light.
After implementing the recommended design changes, Emily’s team continued to monitor employee satisfaction and productivity. They observed a positive trend, with increased employee engagement and fewer complaints about discomfort.
Conclusion:
In the realm of architecture, DesignScape showcased the power of spatial analysis in optimizing workspace design. Emily Hernandez’s data-driven approach allowed her to identify and address concerns through statistical techniques, ensuring that DesignScape’s workspaces not only dazzled aesthetically but also fostered productivity and well-being. By incorporating spatial analysis into her design process, Emily exemplified the role of corporate professionals in leveraging data to create meaningful and impactful spaces in the modern urban landscape of Urbanville.