Have you ever wondered if your team is truly the best in the league? Or maybe asked yourself if your favorite chocolate really is the most loved one in your friend group? Or even pondered whether that last diet fad was genuinely effective or just another baseless claim? We constantly find ourselves trying to make sense of the world around us, trying to identify patterns and connections, asking questions, and seeking answers.
This innate curiosity, my friends, is where we find the heart and soul of applying a statistical test. Because at its core, applying a statistical test is nothing more than a formalized method for testing an idea, a hypothesis, based on the data we observe.
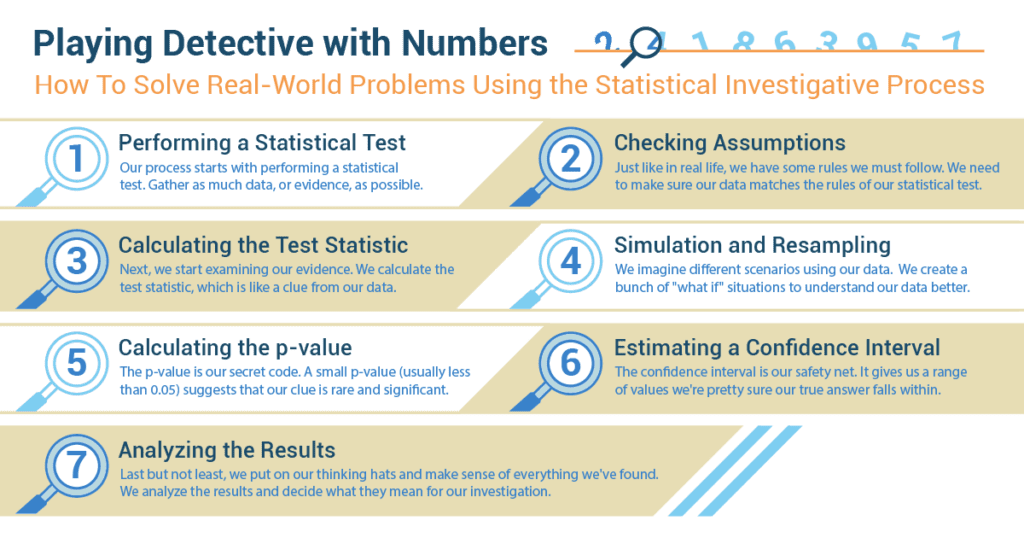
Performing a Statistical Test
Imagine being a detective. But instead of clues, we’re looking at numbers. Our process starts with performing a statistical test. Think of this as starting a new detective case. You’d want to gather as much data, or evidence, as possible.
Step 1: Checking assumptions
Just like in real life, we have some rules we must follow. We need to make sure our data matches the rules of our statistical test. For example, if we’re investigating whether boys and girls in our school spend the same amount of time doing homework, our rules may include:
- The data is about time spent on homework.
- We include both boys and girls.
- All responses are honest and clear.
Step 2: Calculating the test statistic
Next, we put our detective goggles on and start examining our evidence. We calculate the test statistic, which is like a clue from our data. This could be the average time spent on homework by boys versus girls.
Step 3: Simulation and resampling
Now comes the fun part. We imagine different scenarios using our data. This is called simulation and resampling. Like replaying a scene at a crime location to get more insights, we create a bunch of “what if” situations to understand our data better.
Step 4: Calculating the p-value
The p-value is our secret code that tells us how surprising our clue (or test statistic) is. A small p-value (usually less than 0.05) suggests that our clue is rare and significant. It’s like finding a hidden treasure map in a detective case.
Step 5: Estimating a confidence interval
The confidence interval is our safety net. It gives us a range of values we’re pretty sure our true answer falls within. It’s like knowing our suspect is hiding somewhere within a certain city block.
Step 6: Analyzing the results
Last but not least, we put on our thinking hats and make sense of everything we’ve found. We analyze the results and decide what they mean for our investigation.
Analyzing Meteor Showers
 For her final school project, Lily decided to conduct an analysis of meteor shower occurrences. Her hypothesis was that the major meteor showers – Perseids, Leonids, and Geminids – do not occur at random throughout the year.
Lily first assembled her data, meticulously noting the dates of each meteor shower for the past 50 years. She structured this data into a contingency table with months as rows and meteor shower types as columns. Then, she began her analysis, applying the Chi-Square Test of Independence, a popular choice for examining the possible relationship between two categorical variables.
Once she collected and compared her data, she used the Chi-Square statistic to see how much the observed results differed from what she expected. This statistic helped her understand if the timing of the meteor showers was just random or if there was a connection between them. If the Chi-Square statistic was big, it meant there’s more evidence against the idea that the timing was random or independent.
A little jittery with anticipation, Lily then calculated her p-value, the probability of observing a Chi-Square statistic as extreme as hers, assuming the null hypothesis was true. To her delight, the p-value was smaller than her chosen significance level of 0.05. This meant that the data provided strong evidence to reject the null hypothesis – the major meteor showers did, in fact, follow a pattern.
Buoyed by this discovery, Lily decided to go a step further. She wondered whether certain meteor showers were more likely to occur in specific months. Using her contingency table again, she performed post-hoc testing to pinpoint the specific cells in her table that contributed most to the Chi-Square statistic.
When Lily presented her findings to the class, she carefully explained each step of her process, sharing her data, detailing her calculation of the Chi-Square statistic, and elaborating on the implication of her significant p-value. The class was captivated, and even more so when she described the more likely timing of each meteor shower, drawing specific links to months with higher occurrences.
Her statistics teacher was impressed, praising Lily’s practical application of the Chi-Square test. “Statistics is not just about numbers; it’s about understanding and interpreting the world around us.”