The AI insights feature in Power BI is a powerful tool that combines the power of artificial intelligence and data visualization to help you make informed decisions, identify trends, and unlock insights hidden in your data.
Steps to get started with AI insights:
- Firstly, head over to Power BI and open your report. We need to add some data that we want to analyze. For this example, let’s say you own a chain of retail stores and want to investigate the factors that impact your sales. You already have a dataset containing information about your store’s locations, products, sales amounts, and customer demographics.
- Now let’s add some AI-driven insight to our report. On the Home tab, click “Edit Queries” and “Edit Queries” again. This opens the Power Query Editor, where we’ll access the AI insights feature.
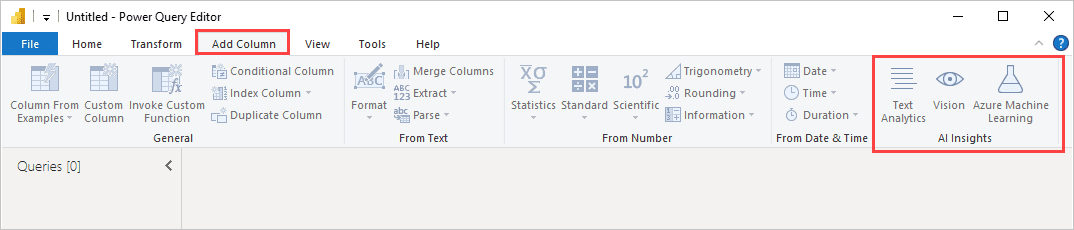
- Once in the Power Query Editor, click on the “Add Column” tab and choose “AI insights.” A new pane will appear with a list of AI functions that can help you analyze your data. We’ll start with the “Key Influencers” function, which will help us identify the main factors driving our store’s sales.
- Select the column you want to analyze in the “Key Influencers” dialog box. For our example, we’ll choose the “Sales Amount” column. The function will automatically suggest several columns to consider, but you can choose to add or remove any columns you think might impact the sales amount. In this case, we’ll keep the suggestions and select the Product, Store Location, and Customer Demographic columns.
- Click “Invoke” to apply the Key Influencers function to the data. This process may take some time as the AI analyzes the dataset.
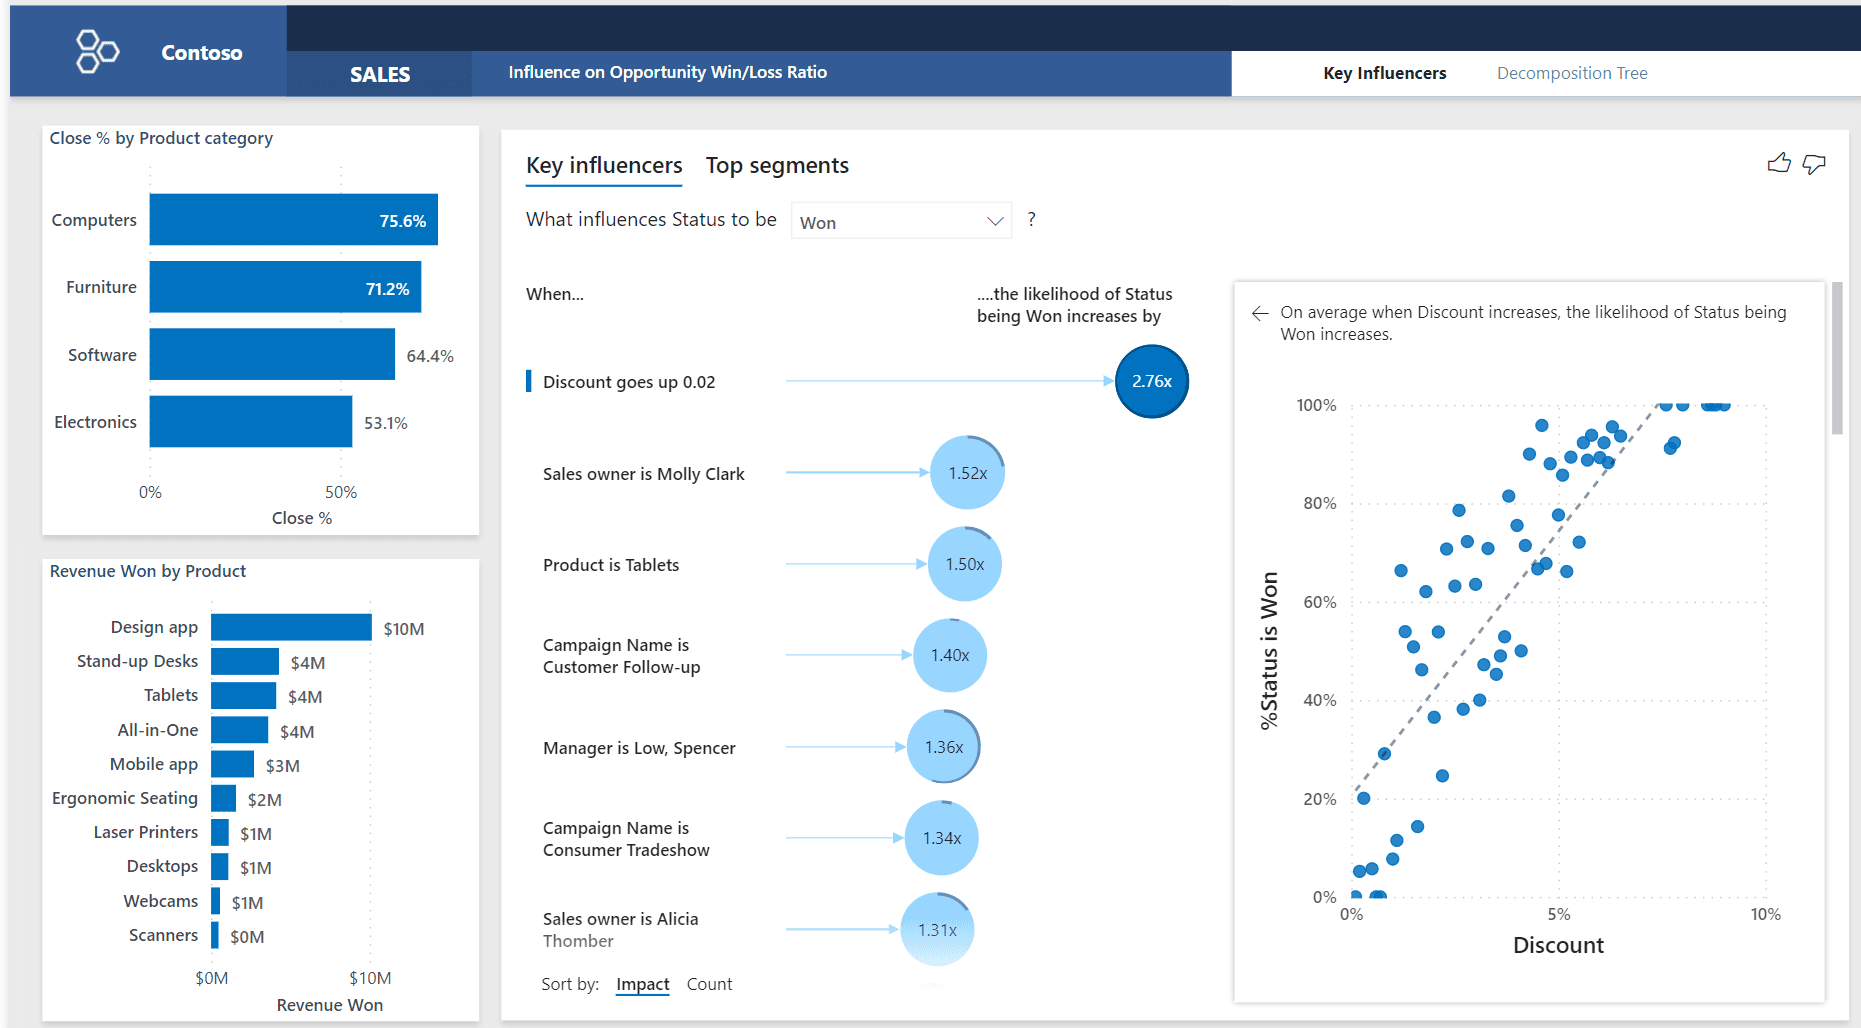
- Once the process is complete, a new “Key Influencers” column will appear in your dataset. This column contains numeric values representing the importance of each factor in influencing your store’s sales. The higher the number, the more significant the influence.
- Head back to your report and add a visual to display the results. In this case, a bar chart is an effective way to show the key influencers. To create one, click on the “Bar chart” icon on the Visualizations pane, then drag and drop the “Key Influencers” column into the values field.
- To ensure that the chart is easily understandable, sort the values in descending order so the most important influencers appear at the top. You can also customize the chart’s design, colors, and layout to make it more visually appealing.
- Once you’re satisfied with your visual, save your report and share it with your team. Now you can use the AI insights in Power BI to make informed decisions about which factors to prioritize in your retail strategy.
The AI Insights tool in Power BI can support advanced analytics by providing Automated Machine Learning (AutoML) capabilities to analyze and model data. AI Insights can be used to perform various advanced analytics tasks, such as predictive modeling, text analytics, and image analytics.
Here are a few ways that the AI Insights tool can support advanced analytics in Power BI:
- Predictive modeling: The AI Insights tool can be used to create predictive models that can forecast future outcomes based on historical data. This feature can be used to predict customer behavior, sales trends, and other business metrics. AI Insights uses AutoML to automatically select the best algorithm and model based on the data, making it easy for non-experts to perform predictive modeling.
- Text analytics: The AI Insights tool can be used to analyze text data, such as customer feedback, social media posts, and support tickets. This feature can be used to extract insights from unstructured data and to identify trends and sentiments. AI Insights uses Natural Language Processing (NLP) to automatically extract entities, key phrases, and sentiments from text data.
- Image analytics: The AI Insights tool can analyze image data, such as product or medical images. This feature can be used to classify images, identify objects and patterns, and detect anomalies. AI Insights uses computer vision to automatically analyze image data and extract insights.
Overall, the AI Insights tool in Power BI can support advanced analytics by providing AutoML capabilities to analyze and model data. This feature can be used to perform predictive modeling, text analytics, image analytics, and other advanced analytics tasks. By automating the analytics process, AI Insights makes it easier for non-experts to perform advanced analytics and gain insights from their data.