Time intelligence is an incredibly powerful feature in Power BI that helps you analyze and visualize your data based on time. This can be especially helpful when you’re working with sales and marketing data, inventory management, financial data, or any other time-based information.
The concept of time intelligence essentially refers to the ability of Power BI to understand, interpret, and analyze time-related data, such as dates, months, quarters, and years. These time-based calculations and comparisons allow you to gain deeper insights into your data and make more informed business decisions.
Here are a few common scenarios where time intelligence can play a crucial role in your data analysis:
- Comparing Sales Data Across Different Time Periods: Suppose you’re a sales manager at a retail company, and you want to compare the sales performance of this month with the previous month. Time intelligence functions in Power BI, such as DATEADD and SAMEPERIODLASTYEAR, can easily help you create a comparison chart that displays the sales revenue for the current month and the same month in the previous year. This helps you identify any trends or seasonal patterns in your sales data and make better decisions regarding promotions or inventory adjustments.
- Analyzing YoY (Year over Year) Growth: If you’re a financial analyst, tracking and visualizing the Year-over-Year (YoY) growth in your company’s revenue, profits, or expenses is vital. Time intelligence functions like TOTALYTD, and CALCULATE can help you compare the current year’s Year-to-Date (YTD) figures with the previous year. This allows you to easily identify periods of growth or decline and make forecasts for the rest of the year.
- Calculating Moving Averages: In many businesses, it’s essential to calculate moving averages to smooth out variations in the data, identify trends, and make better predictions. Power BI provides time intelligence functions like DATESINPERIOD and DATESBETWEEN to help you calculate moving averages, such as a 3-month or 6-month moving average, for your data. This can be particularly useful in industries like stock trading and inventory management, where short-term fluctuations might not necessarily represent long-term trends.
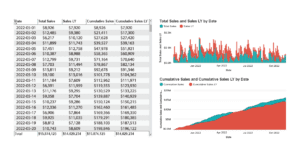
- Visualizing Cumulative Data: Sometimes, it’s important to understand how a particular metric accumulates over time. For instance, if you’re tracking the number of new customers acquired by a subscription-based service, you might be interested in visualizing the cumulative count of customers over time to better grasp the performance of your customer acquisition strategies. With the help of time intelligence functions like DATESYTD and TOTALYTD in Power BI, you can easily create such visualizations to analyze and track your cumulative data.