AI visuals, or Artificial Intelligence visuals, are Power BI components designed to provide advanced analytics and insights by leveraging machine learning techniques. These visuals can process large amounts of data, identify patterns, and display them in an easily understandable format. These visuals help you make better, data-driven decisions by providing more profound insights than traditional visuals.
Popular AI visuals in Power BI and how they can improve insights and decision-making in various business scenarios:
Key Influencers Visual
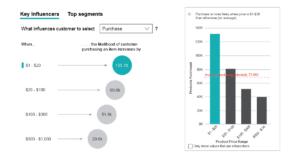
This visual helps you understand the factors that drive a particular metric. It identifies the key variables that influence the outcome you are interested in.
- Example: Imagine you’re an e-commerce manager and want to understand the factors influencing the customer’s purchase decision. By using the Key Influencers visual, you can analyze the data to identify the top factors affecting customer purchase, such as product price, ratings, or shipping time. This insight allows you to optimize your operations and make informed decisions to increase conversions.
Q&A Visual
The Q&A visual allows you to ask natural language questions about your data and instantly receive relevant charts and answers. This feature lets you explore and interact with your data without needing intricate knowledge of Power BI.
- Example: As a sales manager, you might be curious about which product category has the highest sales in a specific region. You can simply type “What are the total sales by category in region X?” into the Q&A visual, and it will generate a chart showing this information, enabling you to make better-informed decisions.
Decomposition Tree
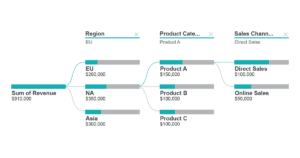
This AI visual helps you break down a specific value (like revenue) into its components and understand its drivers. It allows you to explore your data in a hierarchical structure, revealing the relationships between different aspects of your business.
- Example: Suppose you’re a finance manager analyzing your company’s annual revenue. You can use the decomposition tree to break down the revenue by region, product category, and sales channel, revealing the strengths and weaknesses in your business operations. This in-depth analysis enables you to allocate resources effectively to improve performance.
AI visuals in Power BI bring immense value to your business analytics and decision-making process. They empower you to uncover patterns, generate insights, and make data-driven improvements across your organization’s aspects. Utilizing these tools will enhance your ability to make informed decisions and stay competitive in the ever-evolving market landscape.

