Data analysis is all around us, shaping our decisions and the world we live in. Think about the choices you make daily, like picking a movie or a restaurant. You instinctively turn to data analysis, checking reviews, and seeking recommendations. That’s the essence of data analysis – gathering and analyzing data to make informed choices.
Now, imagine you’re working on a project. Planning data analysis is crucial to bring clarity to your study. It ensures your research is meaningful, valid and generates valuable insights. Without proper planning, your project can be confusing and lead to biased or misleading conclusions.
Why Is it Important to Decide on How You’ll Analyze Data?
- Alignment with research question: Choosing an appropriate data analysis method that aligns with your research question is crucial for several reasons. First and foremost, it ensures that the analysis is relevant to the specific objectives and goals of your study. The analysis should directly address the research question and provide insights or answers that contribute to the overall research objective.
- For example, if your research question aims to understand the relationship between two variables, such as the impact of exercise on work performance, you would need to choose an analysis method that can assess the correlation or regression between these variables. Selecting a method that is not directly related to the research question, such as descriptive analysis that merely summarizes the data, would not provide the necessary information to answer the research question accurately.
- Fit with data: Analyzing data in a manner that is suitable for the collected data ensures compatibility and optimal utilization. Different types of data require specific analysis techniques to extract meaningful insights.
- Quantitative data, which consists of numerical measurements, often lends itself to statistical analysis methods such as t-tests, Analysis of Variance (ANOVA), or regression. These methods allow for the examination of relationships, comparisons between groups, and prediction of outcomes.
- On the other hand, qualitative data, such as interview transcripts or open-ended survey responses, requires qualitative analysis techniques like thematic analysis or content analysis. These methods involve identifying patterns, themes, or categories within the data to gain a deeper understanding of the underlying meanings or perspectives. By selecting an analysis method that fits the data type, you can leverage the strengths of the data and derive meaningful interpretations. Trying to analyze quantitative data using qualitative techniques or vice versa may lead to inaccurate or incomplete results.
- Validity and accuracy: Proper data analysis techniques enhance the validity and accuracy of your results.
- Validity refers to the extent to which the analysis method measures what it intends to measure. By choosing a method that aligns with the research question and the nature of the data, you increase the validity of your findings.
- Accuracy, on the other hand, refers to the degree of correctness or reliability of your results. Selecting appropriate analysis methods ensures that the conclusions drawn from the data are reliable and free from biases or errors. For instance, using inferential statistical tests to assess the significance of relationships or differences in data can provide a level of confidence in the findings.
Choosing the Right Way to Analyze Data
Choosing the right way to analyze data is a critical step in the research process. It involves considering various factors to ensure that the analysis method aligns with the research question, data type, and objectives of the study. Here are some key considerations when selecting an appropriate analysis approach:
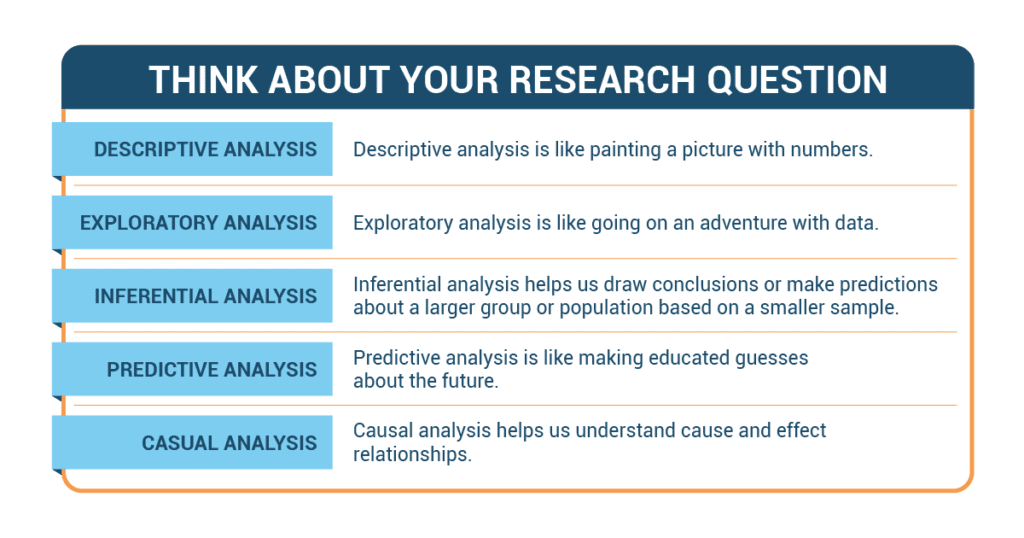
Think About Your Research Question
- Descriptive analysis: Descriptive analysis is like painting a picture with numbers. It helps us summarize and describe data using numbers and charts. For example, if we want to know the average height of employees in a company, we would use descriptive analysis to find that out. A limitation of descriptive analysis is that it only provides information about the dataset at hand and doesn’t allow for conclusions beyond the data.
- Exploratory analysis: Exploratory analysis is like going on an adventure with data. It helps us discover new insights, patterns, or trends that we didn’t know before. It allows us to explore data without having a specific hypothesis or question in mind. A limitation of the exploratory analysis is that it is focused on providing insights about the dataset at hand and doesn’t formally test patterns or confirm causal relationships it finds in the data.
- Inferential analysis: Inferential analysis helps us draw conclusions or make predictions about a larger group or population based on a smaller sample. It uses statistical methods to make educated guesses or inferences about what the whole population might be like based on the data we have.
- Predictive analysis: Predictive analysis is like making educated guesses about the future. It uses data and patterns from the past to make predictions or forecasts about what might happen next. For example, if we want to predict if it will rain tomorrow based on weather data from previous days, we would use predictive analysis.
- Causal analysis: Causal analysis helps us understand cause and effect relationships. It explores how one thing or variable influences or causes changes in another. For example, if we want to find out if eating a healthy breakfast leads to better concentration, we would use causal analysis.
-
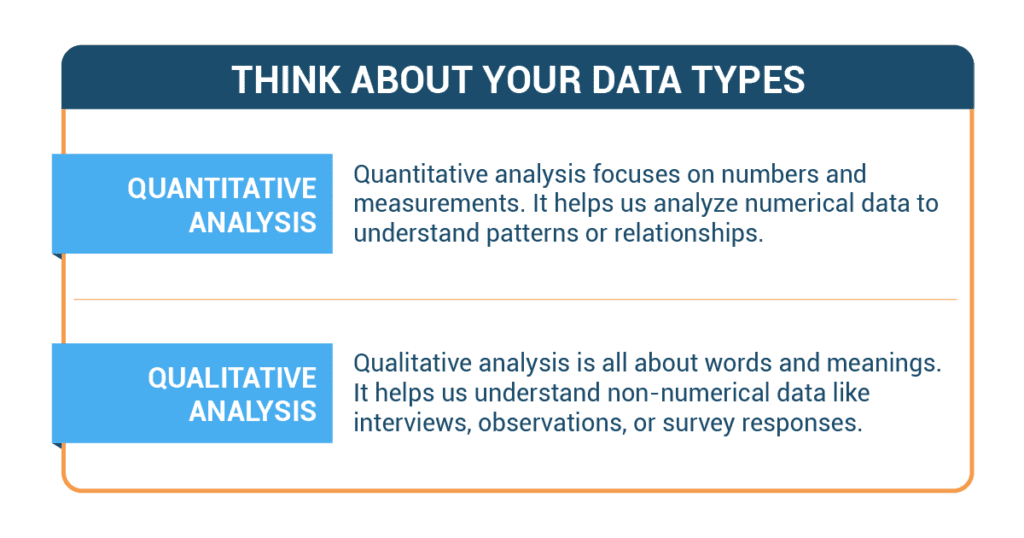
Think About Your Data Types
- Quantitative analysis: Quantitative analysis focuses on numbers and measurements. It helps us analyze numerical data to understand patterns or relationships. For example, if we want to see if there is a connection between the number of hours employees make presentations and their ratings, we would use quantitative analysis. Quantitative analysis may overlook the context or subjective differences that qualitative data can provide.
- Qualitative analysis: Qualitative analysis is all about words and meanings. It helps us understand non-numerical data like interviews, observations, or survey responses. It focuses on finding themes, patterns, or insights from the words people use. For example, if we want to understand why people enjoy playing music, we would use qualitative analysis to analyze their written responses. Qualitative analysis often comes at the cost of lost precision since it is asking about words or descriptions that are difficult to measure precisely.
-
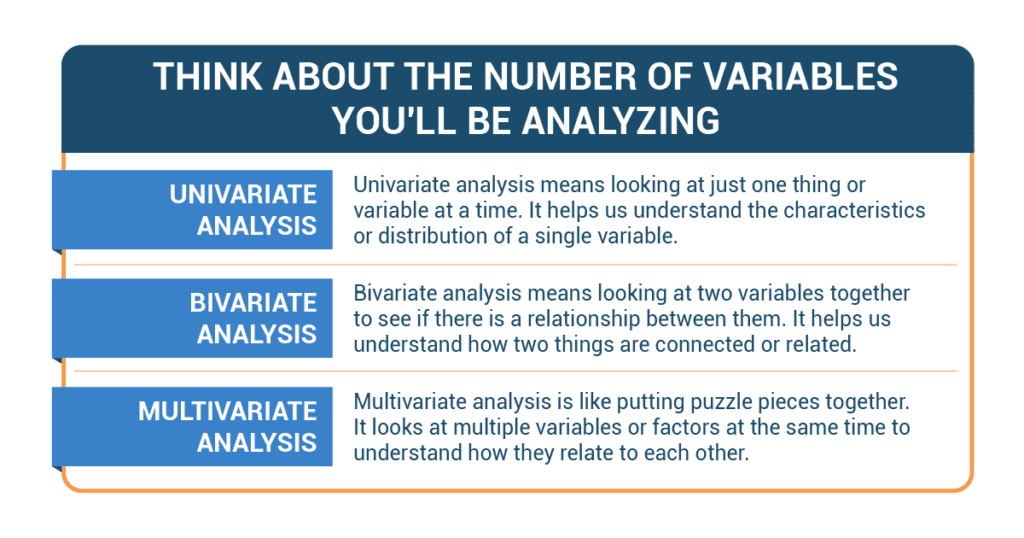
Think About the Number of Variables You’ll Be Analyzing
- Univariate analysis: Univariate analysis means looking at just one thing or variable at a time. It helps us understand the characteristics or distribution of a single variable. For example, if we want to know how many employees in a department play a musical instrument, we would use univariate analysis to count and see the results. The univariate analysis doesn’t consider relationships or interactions between variables.
- Bivariate analysis: Bivariate analysis means looking at two variables together to see if there is a relationship between them. It helps us understand how two things are connected or related. For example, if we want to see if there is a relationship between the amount of exercise employees get and their performance ratings, we would use bivariate analysis. The bivariate analysis only considers two variables and may overlook the impact of other variables.
- Multivariate analysis: Multivariate analysis is like putting puzzle pieces together. It looks at multiple variables or factors at the same time to understand how they relate to each other. For example, if we want to know how both age and gender affect employees’ satisfaction ratings, we would use multivariate analysis. Multivariate analysis requires larger sample sizes and can be complex to interpret.
-
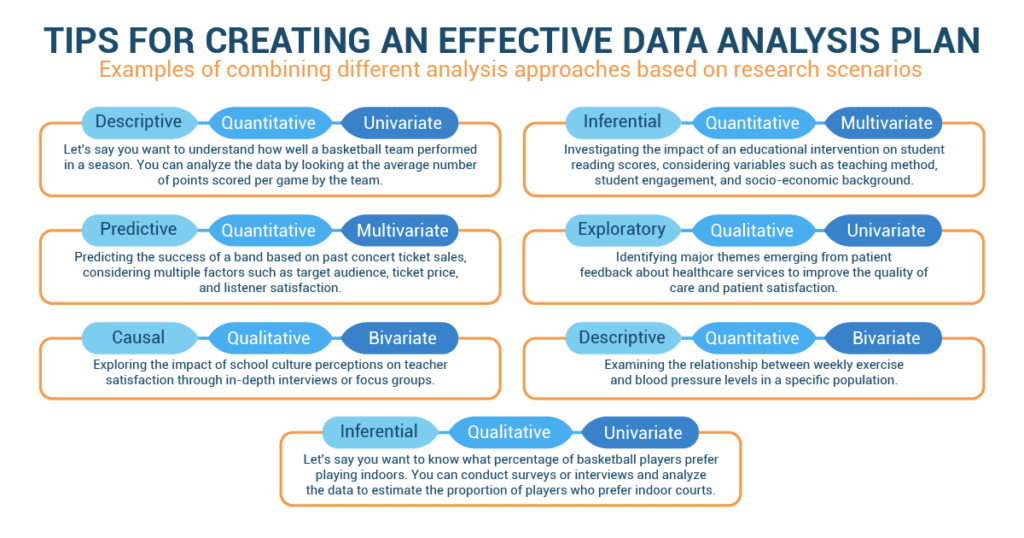
Combining Different Analysis Approaches Based on Research Scenarios
- Descriptive, quantitative, univariate: A type of research where we collect information about a single variable and describe it using numbers.
- Let’s say you want to understand how well a basketball team performed in a season. You can analyze the data by looking at the average number of points scored per game by the team.
- Predictive, quantitative, multivariate: A type of research where we use numbers and measurements to analyze multiple variables and predict outcomes.
- Predicting the success of a band based on past concert ticket sales, considering multiple factors such as target audience, ticket price, and listener satisfaction.
- Causal, qualitative, bivariate: A type of research where we explore the cause-and-effect relationship between two variables using qualitative data.
- Exploring the impact of cultural perceptions on satisfaction through in-depth interviews or focus groups.
- Inferential, quantitative, multivariate: A type of research where we make inferences or draw conclusions about a population based on quantitative data collected from multiple variables.
- Investigating the impact of an intervention on employee ratings, considering variables such as methods, engagement, and socio-economic background.
- Exploratory, qualitative, univariate: A type of research where we explore a research topic in-depth using qualitative data focused on a single variable.
- Identifying major themes emerging from patient feedback about healthcare services to improve the quality of care and patient satisfaction.
- Descriptive, quantitative, bivariate: A type of research that aims to describe and analyze the relationship between two variables using quantitative data.
- Examining the relationship between weekly exercise and blood pressure levels in a specific population.
- Inferential, qualitative, univariate: A type of research that aims to make inferences or draw conclusions about a specific characteristic or phenomenon using qualitative data from a single variable.
- Let’s say you want to know what percentage of basketball players prefer playing indoors. You can conduct surveys or interviews and analyze the data to estimate the proportion of players who prefer indoor courts.
Crafting a Comprehensive Data Analysis Plan for Perfume Preferences
In the world of fragrances and beauty, Sarah Mitchell, a seasoned corporate professional with a keen interest in perfumery, found herself undertaking a project that would uncover the intricate nuances of perfume preferences. Her journey revolved around the meticulous planning of data analysis, fusing her corporate expertise with her fascination for scents. Sarah’s project aimed to decode the complex tapestry of perfume preferences among consumers. Her corporate background had taught her the significance of methodical analysis in extracting meaningful insights. She recognized that a well-structured data analysis plan would be key to unveiling patterns and trends within the vast world of fragrances.
Sarah understood that a data analysis plan was pivotal to her project’s success. Armed with her corporate acumen, she embarked on a journey to outline the steps that would guide her analysis process, ensuring that her findings were both accurate and insightful. The first step was to define clear objectives for her data analysis efforts. Sarah’s aim was to uncover clusters of perfume preferences based on scent families, as well as to identify any associations between fragrance preferences and demographic factors like age, gender, and lifestyle.
Drawing from her experience in data management, Sarah recognized the importance of cleaning and preparing her data. She meticulously reviewed the collected survey responses, identifying any outliers or inconsistencies that could skew her analysis. Applying corporate rigor, she ensured that her data was pristine and ready for analysis. Sarah knew that segmentation techniques would be instrumental in unraveling patterns among diverse perfume preferences. Inspired by her corporate role in market segmentation, she decided to employ clustering algorithms to group similar fragrance profiles together. This approach would help her identify distinct fragrance preferences and consumer segments.
Considering the multifaceted nature of perfume preferences, Sarah planned to conduct correlation and regression analyses. Drawing from her corporate experience in analyzing market trends, she aimed to uncover relationships between fragrance preferences and various demographic factors. This would enable her to identify potential influencers of scent preferences. Sarah recognized that the qualitative aspects of perfume preferences, such as the emotions associated with different scents, were equally important. Leveraging her corporate communication skills, she planned to extract qualitative insights from open-ended survey responses, using sentiment analysis to gauge emotional associations with specific fragrances.
Ethics remained at the forefront of Sarah’s planning process. She understood the importance of anonymizing survey responses and safeguarding participant privacy. Applying her corporate professionalism, she ensured that her analysis methods aligned with ethical standards. Armed with her meticulously designed analysis plan, Sarah was poised to visualize and interpret her findings. She planned to create visualizations that would present clusters of fragrance preferences and correlations between scents and demographics. Her corporate attention to presentation would ensure that her results were easily digestible and actionable.
As Sarah executed her data analysis plan, the insights began to emerge. Her case study underscores how a corporate professional’s structured approach can elevate the quality of data analysis. Through her strategic thinking and fascination with perfumery, Sarah’s journey exemplifies the art of designing a robust data analysis plan that not only uncovers trends but also bridges the world of corporate precision with the allure of fragrances.