Hello!! Imagine for a moment that you’ve just opened your favorite weather app. You see there’s a 90% chance of rain ☔. Without a second thought, you grab your umbrella as you head out for the day. Now, have you ever stopped to think about how that app knows it’s going to rain? The answer lies in the amazing world of statistics! Yes, you heard me right, statistics. It’s not a topic we talk about over dinner or a casual chat, but it’s incredibly powerful and underpins many decisions we make every day!
Think about the times you’ve made choices based on ‘most popular’ or ‘most viewed’ 📊, or even opted for the product that ‘4 out of 5’ people prefer. All of these are statistical conclusions that guide our daily choices.
The statistical investigative process is a fascinating process that converts raw data into valuable insights that can influence our decisions, shape our opinions, and even predict our futures! From forecasting weather to predicting market trends, it’s a tool that helps us navigate our world more confidently.
Answering Questions with Data
The statistical investigative process is a tool that helps us answer questions by leveraging the power of data. It provides a roadmap outlining the necessary steps to follow.
A Structured Approach
The first way the statistical investigative process helps us is by providing a structured approach. This structured approach ensures that researchers stay on track and maintain a logical flow throughout the investigation.
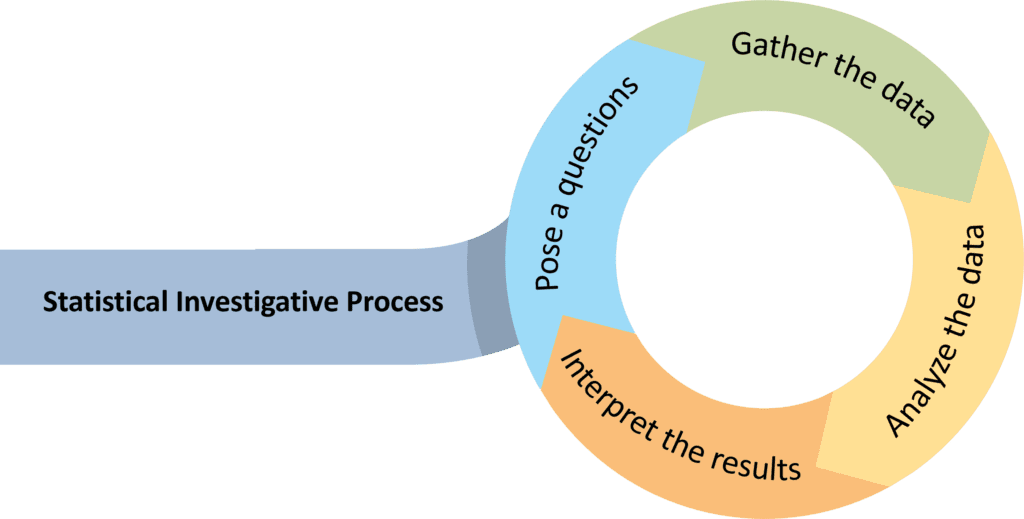
- Pose a question. A clear and focused inquiry serves as the starting point. By formulating a specific question, researchers can define the scope of their investigation and direct their efforts accordingly.
- Gather the data. Collecting relevant data could involve conducting surveys, experiments, or analyzing existing datasets. The data collected should be reliable, accurate, and directly related to the research question. By carefully selecting and gathering appropriate data, researchers ensure that they have a solid foundation for their analysis.
- Analyze the data. Once the data is collected, researchers move on to analyzing it. This involves applying statistical techniques and tools to identify patterns, relationships, and trends within the data. Through analysis, researchers can extract valuable insights and draw conclusions.
- Interpret the results. This involves making sense of the findings obtained through analysis. Researchers evaluate the implications of the results, draw meaningful conclusions, and communicate their findings effectively. This interpretation helps us understand the story the data tells and allows us to draw valid and reliable conclusions.
Making Better Decisions
The statistical investigative process is not only about finding answers; it also helps us make better decisions based on evidence. The statistical investigative process used relies on evidence over assumptions. When faced with questions or problems, relying on guesswork or assumptions is easy. However, the statistical investigative process encourages us to base decisions on evidence. By gathering and analyzing data, we can make informed choices supported by factual information. This evidence-based decision-making approach reduces uncertainty, minimizes biases, and increases the likelihood of making sound decisions.
Case Study – Planning a School Trip
 Let’s follow the journey of Chris, a high school junior, tasked with planning the annual school trip. The challenge? Determine a destination that would make the majority of his 500 classmates happy and keep within the budget.
Chris thought, “Why not use a little bit of statistics to guide the decision?”
Chris started with a clear question: “What is the most popular and affordable destination for our annual school trip, according to my classmates?”
In order to address data collection, he designed a short, engaging survey asking his classmates to rank their top three preferred destinations from a list and how much they’d be willing to spend on the trip.
With hundreds of responses in hand, Chris moved on to the analysis stage. He calculated the mean amount students were willing to spend and determined the most popular destinations based on their rankings.
During the interpretation stage, Chris discovered that the top three destinations were a local amusement park, a beach resort, and a camping trip. However, when he cross-checked these with the average amount students were willing to pay, he found that only the amusement park fell within the budget.
Empowered with his statistical investigation’s findings, Chris presented his results to the student council and school administrators. Not only was his proposal based on data, but he could also justify his choices, making the decision-making process much easier for everyone involved.
So, what happened? The school trip was a huge success! The majority of students enjoyed the amusement park, and the budget was maintained. Chris’s intelligent use of the statistical investigative process ensured a fun and affordable outing that left everyone satisfied. That’s the power of the statistical investigative process in action!