In the world of statistics, “distribution” is a term that often pops up. But what does it mean, and why is it so important, especially when we’re trying to make sense of data? Let’s dive into the world of distributions and see how they help us in statistical analysis.
What is a Distribution in Statistics?
A distribution is like a summary of all the possible values or ranges of values in a dataset and how frequently they appear. Think of it as a way to organize and understand your data.
How Does Distribution Help?
A glimpse into data patterns
Distributions give us a snapshot of our data. They reveal patterns, showing us things like the average value (central tendency), how spread out the values are (variability), and whether more values are on one side of the average than the other (skewness).
A basis for predictions
Distributions are the backbone of statistical models. They help us make educated guesses or predictions about larger groups (populations) based on a smaller sample of data.
Identifying distribution types
Knowing whether your data follows a normal distribution, a binomial distribution, or another type can guide us in choosing the right statistical tests and understanding our data better.
Understanding probability and outcomes
Distributions and probabilities go hand in hand. They help us understand how likely different outcomes are. For example, in a normal distribution, most data points are near the average, with fewer as you move away from it.
Characteristics of Common Distributions
Let’s look at some common distributions and their unique features.
Normal Distribution
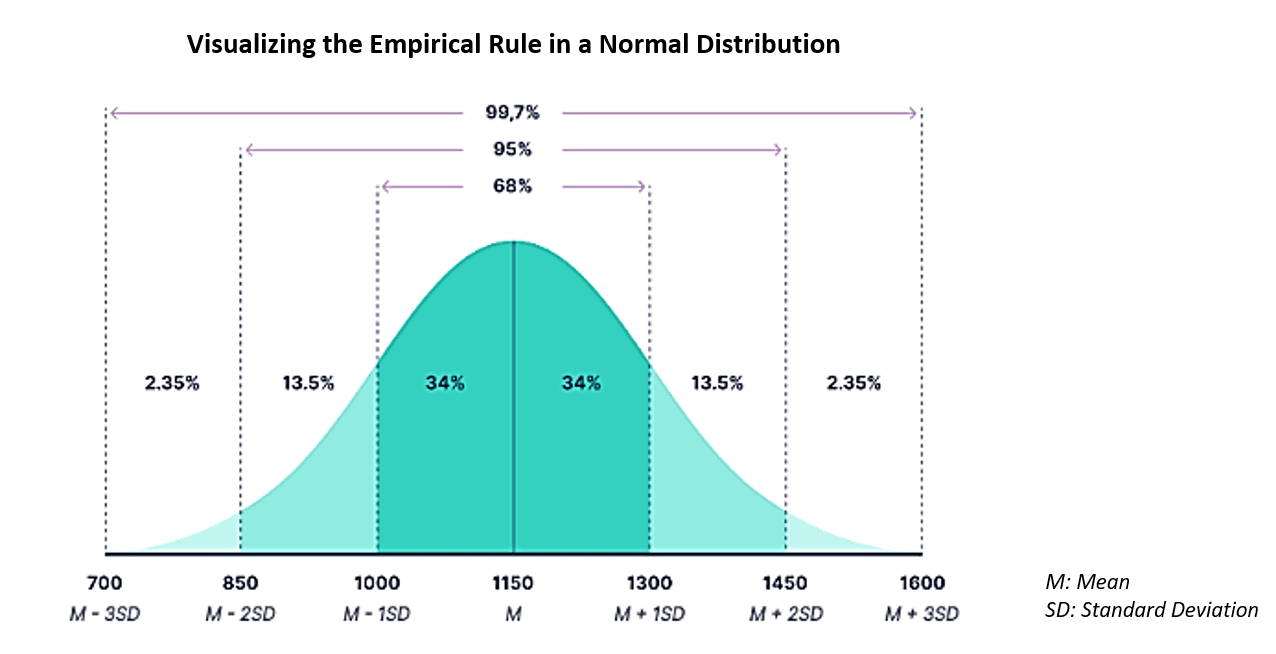
The normal distribution, also known as the bell curve, is symmetric, and most of the data clusters around the mean (average). It follows the 68-95-99.7 rule (empirical rule), meaning 68% of data falls within one standard deviation of the mean, 95% within two, and nearly all (99.7%) within three standard deviations.
*Remember, a standard deviation tells us how spread out the numbers are in a set of data. It’s a way to measure how much the data varies from the average (mean).
Binomial Distribution
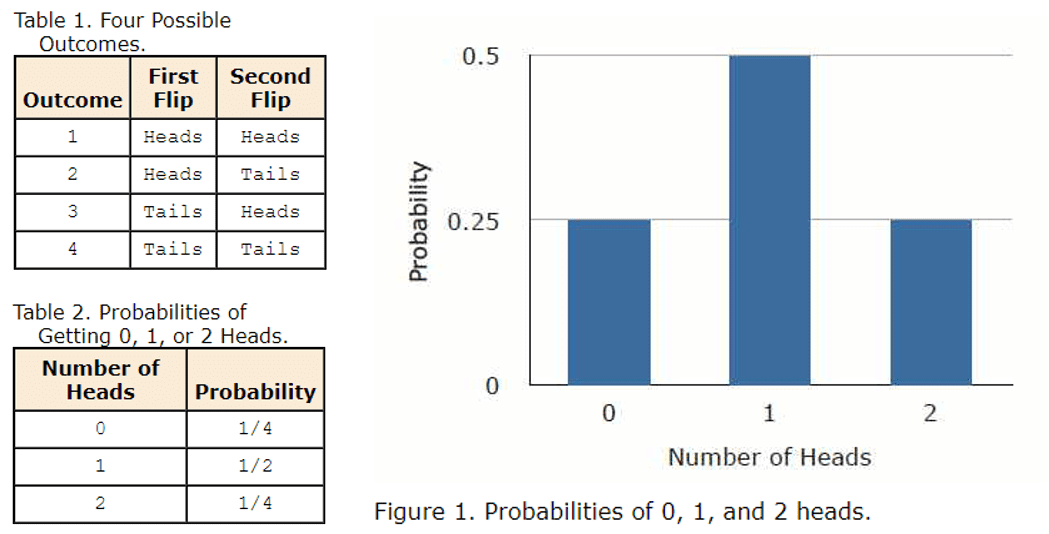
This distribution comes into play when you’re looking at the number of successes in a set number of tries (like flipping a coin). Its shape can be symmetric or skewed, depending on the likelihood of success in each try. Look at the symmetry below when the probability of the number of flipping 1 “heads” is around 0.5. Which way would it skew if it is closer to 0 or 1?
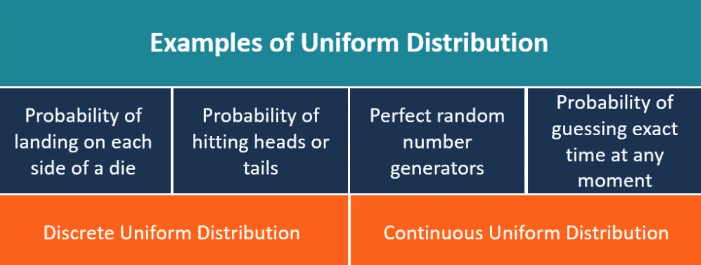
Uniform Distribution
Imagine every outcome having the same chance of happening – that’s a uniform distribution for you. Its graph looks like a flat rectangle, showing equal probability for all outcomes.
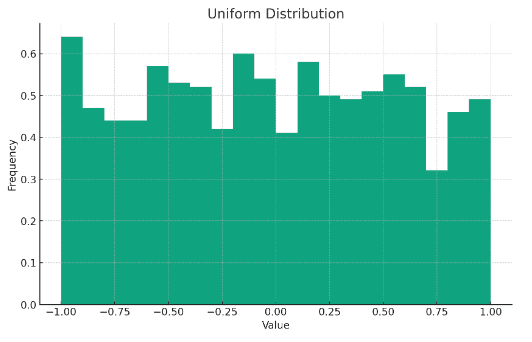
*Note: The above chart demonstrating uniform distribution may not appear to indicate the same probability for each value as it is not a flat rectangle. As the sample size increases, the distribution becomes flatter and flatter, eventually reaching the flat rectangle visualization. It is important to know that the sample size will impact the representation of the distribution, but it is still a uniform distribution.
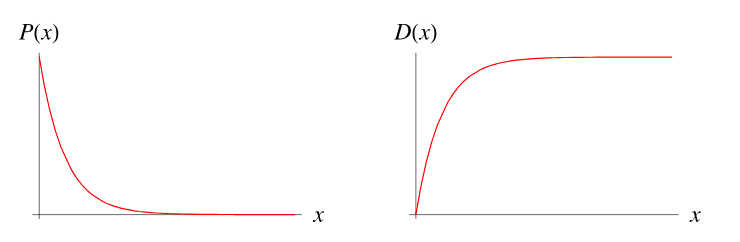
Exponential Distribution
Used to model the time between events, the exponential distribution is skewed to the right. It’s useful in scenarios like measuring the time until the next earthquake or the wait time in a queue.
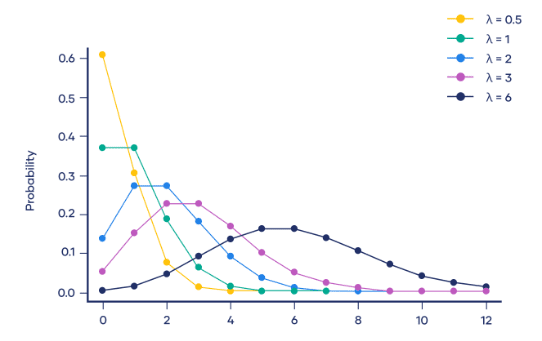
Poisson Distribution
Perfect for counting events in a fixed period, like the number of emails you receive in an hour. The Poisson distribution can be right-skewed for low average numbers of events but becomes more symmetrical as the average increases.
Distributions are a fundamental concept in statistics, helping us make sense of data and predict future trends. Whether it’s the bell-shaped curve of the normal distribution or the right-skew of the Poisson distribution, each type offers a unique lens through which we can view and understand our data.
***Fun Fact*** Uniform Distribution of Penguins
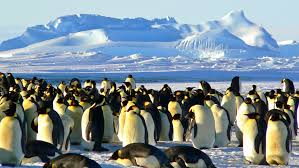
Emperor penguins exhibit uniform distribution patterns: these territorial birds are equally spaced apart. Uniform distributions are found in populations where the distance between neighboring individuals is maximized. The need to maximize the space between individuals often arises from competition for resources, such as food or space, or as a result of direct social interactions between individuals within the population, such as territoriality. For example, Emperor penguins often exhibit uniform spacing by aggressively defending their territory among their neighbors.