This article explores the art of data storytelling through different types of visual data encoding: position, length, angle/slope, area, and volume. It aims to illuminate how each encoding type can be strategically used to tell a compelling story with data, enhancing the audience’s understanding and engagement. Mastering these visual encoding methods will provide valuable skills in transforming complex data into insightful, narrative-driven visualizations.
Data storytelling is the practice of building narratives around data sets to convey insights effectively. Visual data encoding plays a critical role in this, as it involves translating data into visual elements like points, lines, shapes, and volumes on a graph or chart. The choice of encoding type can significantly impact how the audience perceives and interprets the data story. Effective encoding captures attention, clarifies complexities, and emphasizes key messages.
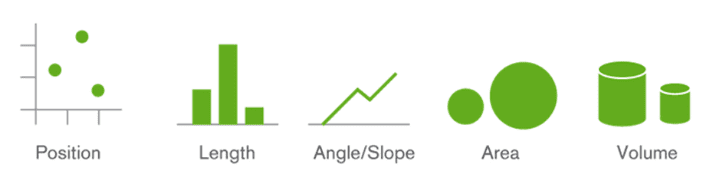
Position Encoding
Description: Involves the placement of elements on a grid or plot. X and Y axes are commonly used to represent different variables.
Why Used: Most effective for identifying relationships between variables, such as in scatter plots or line graphs, due to its intuitive nature and ease of interpretation.
Length Encoding
Description: Uses the length of elements, like bars in a bar chart, to represent data values.
Why Used: Ideal for comparing quantities, as the human eye can judge lengths accurately. It is commonly used in bar charts and histograms for comparing different categories or distributions.
Angle/Slope Encoding
Description: Utilizes angles or slopes, seen in pie charts or slope graphs, to represent data.
Why Used: Effective in showing parts of a whole (as in pie charts) or changes over time (as in slope graphs). However, the interpretation of angles can be less accurate than lengths.
Area Encoding
Description: Represents data through the size of areas, such as in bubble charts or treemaps.
Why Used: Useful for displaying hierarchical data (treemaps) or comparing multiple dimensions of data (bubble charts), but can be less precise due to difficulty in assessing area sizes.
Volume Encoding
Description: Involves using the volume of 3D shapes to encode data values.
Why Used: It can represent additional data dimensions but is less common due to its complexity and potential for misinterpretation in 2D representations.
Choosing the Right Encoding
Factors to Consider: The nature of data, the message to be conveyed, audience understanding, and the accuracy required in interpretation.
Examples and Comparisons: Discuss scenarios where one encoding is preferred over others, highlighting the trade-offs in different choices.