Including the units of measurement in the subtitle of your chart is crucial for helping your audience better understand the presented data, as it enables viewers to easily grasp the values being represented and, ultimately, get the most out of your data visualization.
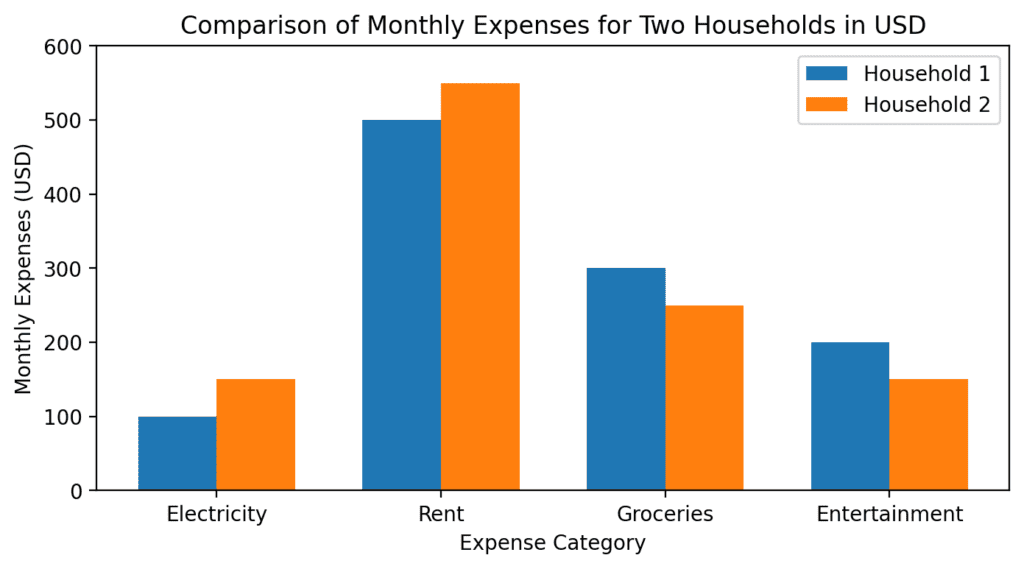
Imagine you’re looking at a chart that compares the monthly expenses of two households. The chart might show the categories, like electricity, rent, groceries, and entertainment, but without including the units of measurement, viewers won’t know if the information is presented in dollars, euros, or another currency. By including the units in the subtitle, such as “Monthly Expenses in USD,” you immediately and clearly communicate the essential information needed to interpret the data.
Here are a few ways in which including units of measurement in your subtitles can enhance your audience’s understanding of your data visualizations:
- Context: Units of measurement provide context for the numerical values in your chart. For example, providing the monetary unit or the unit of time lets your audience know exactly what the numbers represent.
- Comparability: When comparing data across different charts, knowing the units of measurement can help the audience make accurate comparisons. For example, comparing expenses in dollars with expenses in euros without conversion wouldn’t be appropriate.
- Precision: Including the units of measurement helps demonstrate the accuracy and reliability of your chart, as the audience can easily see the level of detail to which the data has been broken down.
- Consistency: Providing the units of measurement consistently across your charts or data visualizations help the audience quickly navigate your work, avoiding confusion and improving data literacy.
In conclusion, incorporating units of measurement into your chart subtitles plays a vital role in ensuring that your audience can easily interpret and derive insights from your data visualization. By providing context, comparability, precision, and consistency, you create a more informed and engaged audience that can confidently navigate your data story.