Think about those times when you’ve faced choices, big or small, that required careful consideration. Maybe you were trying to decide which movie to watch or which outfit to wear. In these moments, you instinctively gathered information and weighed the options. You, my friend, were interpreting the results, albeit on a smaller scale.
Why is interpreting results an essential step in the statistical investigative process?
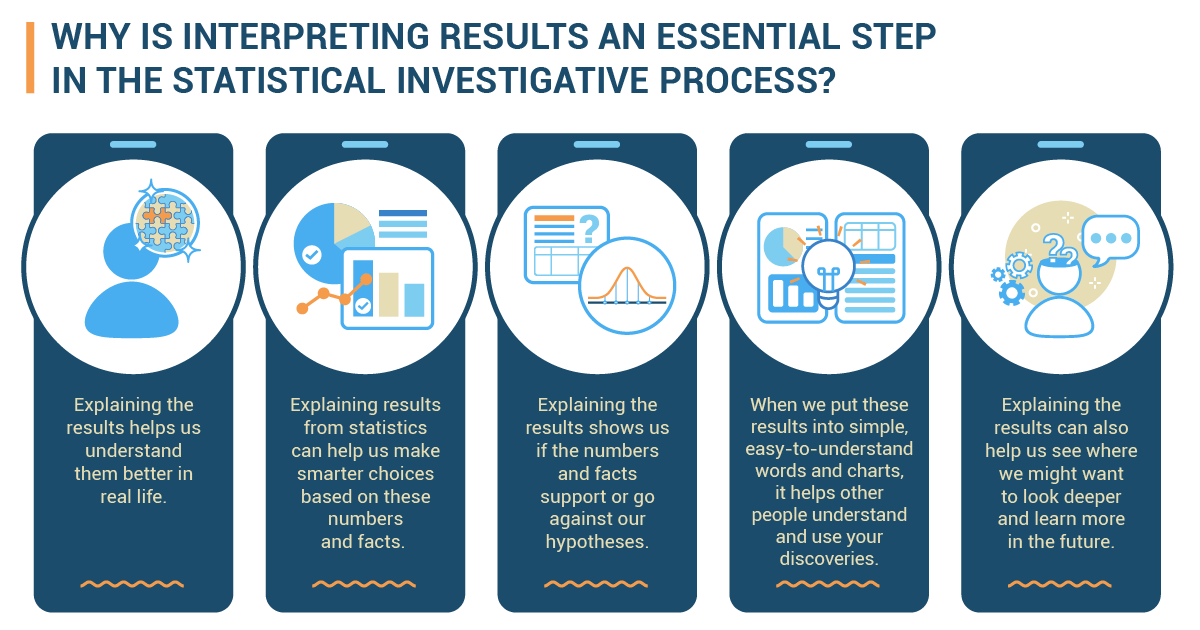
- Explaining the results helps us understand them better in real life.
Imagine you’re looking at a bunch of numbers and facts—maybe the average ratings of your officemates on a recent series of presentations. They might seem dull at first, like a puzzle missing its pieces. But when we explain those results, it’s like magic! We breathe life into those plain numbers and facts, giving them meaning that we can understand.
For instance, let’s say the average rating is 85. That’s a pretty good score, right? Explaining this result tells us that most employees did well. We can celebrate our success and feel proud of our hard work. - Explaining results from statistics can help us make smarter choices based on these numbers and facts.
Now that we understand what those numbers mean, we can use them to make intelligent decisions in our lives. Statistics isn’t just about numbers on a page—it’s about real-life applications!
Knowing what these numbers are telling us can help us in many situations. For example, imagine you’re starting a business selling delicious cookies. By analyzing statistical data, you can figure out which flavors are most popular among your friends and customers. This information guides you in making smart choices about what types of cookies to bake and sell, ensuring your business thrives! - Explaining the results shows us if the numbers and facts support or go against our hypotheses.
Have you ever had a hunch or a guess about something and wanted to see if it’s true? Well, interpreting statistical results can help us figure that out!
When we have a hypothesis (a fancy word for an educated guess), we can use statistics to test it. Let’s say we hypothesize that taller players have higher scores in basketball. We can determine if our idea holds true by analyzing the statistical results. Our hypothesis is supported if the numbers show a clear relationship between height and basketball scores! - Putting these results into simple, easy-to-understand words and charts helps other people understand and use your discoveries.
Statistical investigation isn’t just about personal discovery—it’s about sharing knowledge with others. Explaining our results using simple words and charts is like turning on a light in a dark room. It helps others see what we’ve discovered and makes it easier for them to use that information, too!
Let’s say you’re working on a research project about the effects of listening to music while being productive. If you present your statistical findings in an easy-to-understand way, like a colorful bar chart, everyone can grasp your discoveries quickly. This empowers them to make informed choices about their habits and helps spread knowledge throughout your community. - Explaining the results can also help us see where we might want to look deeper and learn more in the future.
Interpreting statistical results is like opening the door to more knowledge. Sometimes, the results might raise new questions or spark our curiosity to explore further.
For example, suppose you’re studying the relationship between exercise and performance. Your statistical results may show that people who exercise regularly tend to have higher productivity. This finding could motivate you to dig deeper into the reasons behind this connection. Are there specific types of exercise that are more effective? Does exercise affect different activities differently? These new questions inspire further research and learning, leading to even more exciting discoveries!
The steps in the interpretation stage of a statistical study
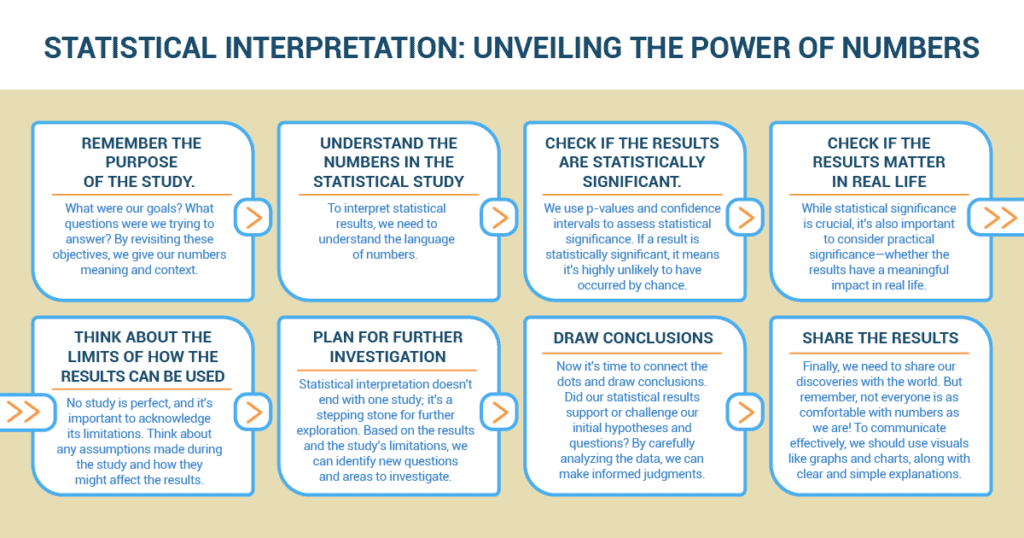
Step 2: Understand the numbers in the statistical study.
To interpret statistical results, we need to understand the language of numbers. We’ll learn important statistics like mean (average), median (middle value), mode (most frequent value), standard deviation (how spread out the data is), correlation coefficients (how variables relate to each other), p-values (probability of results occurring by chance), and confidence intervals (range of values within which the true value is likely to fall).
Step 3: Check if the results are statistically significant.
Statistics can help us determine if our results are not just due to luck or randomness. We use p-values and confidence intervals to assess statistical significance. If a result is statistically significant, it means it’s highly unlikely to have occurred by chance.
Step 4: Check if the results matter in real life.
While statistical significance is crucial, it’s also important to consider practical significance—whether the results have a meaningful impact in real life. Sometimes, statistical significance alone may not capture the full picture.
Step 5: Think about the limits of how the results can be used.
No study is perfect, and it’s important to acknowledge its limitations. Think about any assumptions made during the study and how they might affect the results.
Step 6: Plan for further investigation.
Statistical interpretation doesn’t end with one study; it’s a stepping stone for further exploration. We can identify new questions and areas to investigate based on the results and the study’s limitations.
Step 7: Draw conclusions.
Now, it’s time to connect the dots and draw conclusions. Did our statistical results support or challenge our initial hypotheses and questions? By carefully analyzing the data, we can make informed judgments.
Step 8: Share the results.
Finally, we need to share our discoveries with the world. But remember, not everyone is as comfortable with numbers as we are! To communicate effectively, we should use visuals like graphs and charts, along with clear and simple explanations.
Unveiling Electoral Insights: The Art of Interpreting Statistical Results
In the intricate realm of corporate politics, where data and democracy converge, Robert Foster, a seasoned political analyst at PoliMetrics Inc., embarked on a captivating journey to demystify the art of interpreting statistical results and its significance within the realm of political investigation. Armed with a deep understanding of political dynamics and a commitment to data-driven insights, Robert delved into the world of statistical interpretation, poised to extract meaningful truths that would guide strategic decision-making.
PoliMetrics Inc., a prominent player in political analysis, faced a pressing challenge. The executive team sought to understand the factors influencing voter behavior in a closely contested election. While data had been collected and analyzed, extracting actionable insights from the statistical results proved elusive. Robert recognized that statistical interpretation – the process of uncovering the stories behind the numbers – was paramount to shedding light on voter motivations and shaping effective campaign strategies.
Robert delved into an array of statistical outputs, ranging from voter sentiment surveys and demographic profiles to candidate approval ratings. This intricate mosaic of data formed the backdrop for his exploration into the realm of statistical interpretation, highlighting the nuances and implications of the numbers.
One regression analysis focused on correlating voter turnout with socioeconomic indicators. As Robert dissected the results, he noticed that the coefficients and p-values held the key to understanding the strength and significance of relationships. This statistical scaffolding allowed Robert to identify which socioeconomic factors had the most pronounced impact on voter turnout, empowering him to prioritize targeted outreach efforts in specific communities.
Further into his investigation, Robert encountered a pie chart illustrating voter preferences across different policy domains. He recognized that the chart’s segments needed careful consideration, as their sizes conveyed the relative importance of each policy area. This astute observation allowed Robert to discern which issues resonated most with the electorate, enabling political campaigns to focus messaging on topics that would drive voter engagement.
Synthesizing these insights into a compelling narrative, Robert presented his findings to PoliMetrics Inc.’s political strategy team. His analysis underscored the pivotal role of statistical interpretation in decoding electoral dynamics. Robert’s exploration demonstrated how diving beyond surface numbers and delving into coefficients, p-values, and graphical representations could illuminate the intricacies of voter behavior, guiding campaign strategies and influencing political discourse.
Robert’s mastery of statistical interpretation principles sparked a transformative shift at PoliMetrics Inc. The organization embraced a data-driven approach that prioritized insightful statistical interpretation, fostering collaboration between political analysts and strategists. Inspired by Robert’s narrative, the team refined their statistical analysis methodologies, enhancing their ability to unearth actionable insights and shape successful political campaigns.
In the end, Robert Foster’s expedition into the world of statistical interpretation not only illuminated the path to uncovering political insights but also showcased the transformative potential of data-driven analysis in revolutionizing corporate political strategy.