I’d like you to do something for me. I want you to think about the last meal you cooked. Maybe it was scrambled eggs for breakfast 🍳, a sandwich for lunch 🥪, or a spaghetti dinner for your family 🍝. Now, let’s take a moment to visualize every ingredient you use. The eggs, the milk, the bread, the pasta, the tomatoes 🍅, the herbs 🌿. Each of these ingredients is a piece of data. They all have a role to play in the final dish, but they may not tell you much on their own.
🧐 However, when you combine them using a recipe, they transform into something more: a delightful breakfast, a satisfying lunch, or a heart-warming dinner. The recipe is the process of data analysis and the meal. That is the story the data tells.
But why is it essential to find the story in the data? Why should you care?❓Well, just as you wouldn’t eat raw pasta or drink raw egg, in our increasingly data-driven world, raw data on its own can be almost useless. Or worse, it could be misinterpreted. Only when we ‘cook’ it properly, analyze it, and extract the story it’s trying to tell can we make informed decisions, predict trends, and drive change.
Finding the story in data isn’t just for data scientists or statisticians. It’s for all of us. Just as you combine ingredients to make a meal, every day, you take in raw information and process it to make decisions, big and small. We’re all innate data analysts, telling stories from the world around us.
🌟 Today, I am here to help you enhance that skill, to help you find the compelling narratives hidden in data. Whether improving your business strategy, understanding your customers better, making effective policies, or just making sense of the world around you, I promise that learning to ‘cook’ data🥘📈and find the stories within will change how you see the world. So, let’s put on our aprons, roll up our sleeves, and dive into the fascinating world of data storytelling.
Importance of Data Exploration
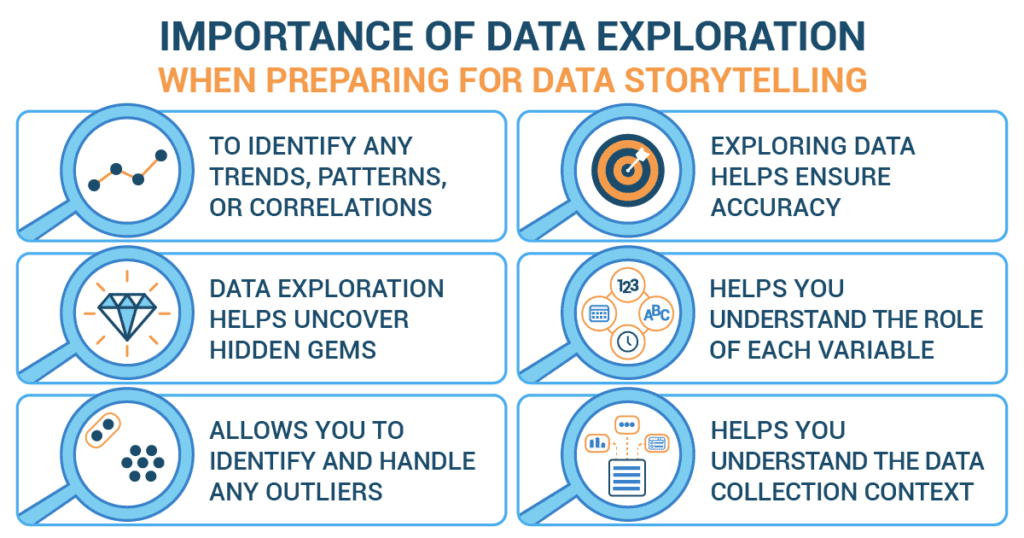
Unearthing a story from a data set begins with an in-depth data exploration. Each number and variable can reveal an essential aspect of our story. Here’s why exploring data is the bedrock of good data storytelling.
- Finding patterns and trends: Identifying patterns, trends, and relationships in data is like discovering our story’s main characters and plot devices. They lend structure to our narrative and help us grasp the overarching themes within the data.
- Ensuring accuracy: Ensuring accuracy in our storytelling is akin to a detective double-checking their clues. It’s a process that helps avoid misinterpretations and false leads. Inaccurate interpretation can lead to faulty conclusions, throwing our audience off track.
- Discovering hidden gems: As we sift through our data, we might stumble upon hidden gems – unexpected insights that can add twists and turns to our story, making it even more compelling.
- Understanding variables: Each variable in our data set has a role to play, much like each character in a novel. By understanding these roles, we can highlight the most impactful variables in our narrative.
- Identifying outliers: Outliers, the odd or unusual values that don’t quite fit the pattern, can be the surprising plot twists in our story. Placing them can add intrigue and depth to our narrative.
- Contextual understanding: Just as the setting of a novel influences the story, the context in which data is collected is critical for our data story. A deep understanding of this context allows us to create a relevant and relatable narrative.
Unearthing the Story in Data
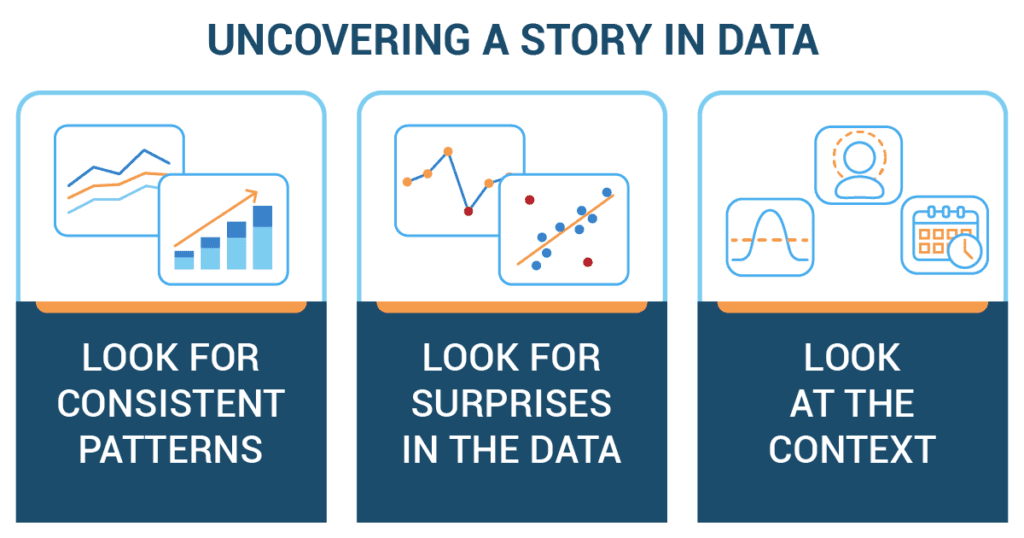
Finding a compelling story in data is akin to piecing together a puzzle. Each number, trend, and outlier forms an integral piece of the bigger picture. Here’s how we find the story in the numbers.
- Consistent patterns: Like a recurring character in our novel, patterns form the backbone of our data story. Trends hint at long-term increases, decreases, or consistent patterns over time; distributions tell us about data spread; clusters reveal groupings, and seasonality highlights recurring events. Together, they shape our data narrative.
- Surprises in data: Unforeseen discoveries, such as outliers (values that stand out from the norm) or sudden changes in data, can often be the thrilling plot twists that make our story exciting. The gaps or absence of expected data can also sometimes tell a story of its own, inviting further investigation.
- Context: Context is our story’s ‘where,’ ‘when,’ and ‘who.’ It adds depth to our narrative, painting a fuller picture and making our account more relatable to the audience. The impact can humanize your data story and make it more relatable to the audience. Comparing data to benchmarks, averages, or other groups can provide perspective.
Best Practices for Finding a Story in Data
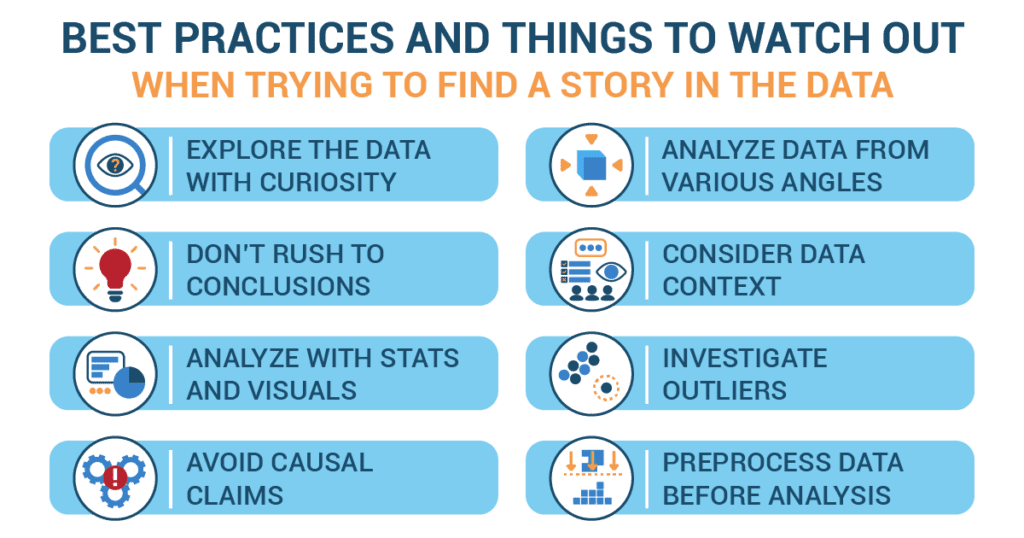
As budding data detectives, there are some essential tips and precautions to help you in your investigative journey:
- Be curious: Embrace your curiosity and let it guide your initial exploration of the data. Don’t be shy about asking questions and exploring different angles. As your exploration progresses, your questions may evolve. This is a natural process and can lead to richer insights.
- Examine data from different dimensions: A single-variable analysis may only provide a partial view of the story. Considering multiple variables simultaneously can provide a more comprehensive understanding of your data.
- Use comparisons: Highlight the differences and similarities in the data to illustrate your main point. By spotlighting these aspects, you create a compelling picture that not only informs but also persuades.
- Don’t rush to conclusions: Just as a detective doesn’t jump to conclusions before gathering all the evidence, don’t rush to conclusions when exploring data. Premature findings can lead to an inaccurate or misleading narrative.
- Avoid cherry-picking data: Maintaining objectivity is critical in data storytelling. Resist the urge to cherry-pick data that supports your initial hypothesis. Let the data guide your story, not the other way around.
- Always consider the context: The context in which the data was collected and is being analyzed can dramatically change the interpretation of the data.
- Use statistical measures and visualization techniques: These tools will help you understand your data better.
- Investigate outliers: the odd ones in our data are often dismissed as errors. But if we look closer, they can sometimes reveal the most exciting parts of our story.
- Caution with causal claims: Be cautious when claiming that one variable causes another. Correlation doesn’t imply causation. Always consider and discuss other possible explanations.
- Clean your data: Like a detective ensuring their evidence is untampered, make sure your data is free of errors, missing values, or inconsistencies before you dive into analysis.
Embarking on the journey to find the story in data is an adventure full of thrilling discoveries and unexpected twists. Put on your detective hat, young data explorers, because it’s time to solve some data mysteries!
Slam Dunk Statistics: Sasha’s Sports Data Investigation
 The murmur of the classroom was broken as Mr. Johnson, Sasha’s statistics teacher, passed a printout containing data on the school’s basketball games over the past five seasons. Sasha, an avid basketball player, was intrigued. She could often be found shooting hoops after school, but this time, she had the chance to explore her passion from a new angle – through data.
Sasha began by immersing herself in numbers, statistics, and game records. She was embarking on a quest to discover patterns and trends within the data. With her keen eye for details, Sasha spotted several directions, such as the steady increase in three-point attempts per game over the seasons.
Accuracy was of paramount importance to Sasha. She meticulously verified the numbers and stats. She spotted a couple of data inconsistencies and reached out to her coach to clarify. With the accurate data, she started constructing the first draft of her story.
As she dove deeper, Sasha noticed a surprising outlier. The record showed a spike in points scored in a particular game from two years ago. Instead of dismissing it, she remembered Mr. Johnson’s lesson about the potential significance of outliers. She decided to investigate and discovered that it was a game in which the school’s star player had scored an extraordinary number of points. This game became the dramatic climax of her data narrative.
Sasha understood that each game and season was part of a broader context. She discussed the performance trends with her coach to understand the underlying strategies or changes during those seasons. This helped her to contextualize the data and add depth to her story.
Using the patterns she had identified and the context she had gathered, Sasha started to weave her narrative. The story wasn’t just about scores and games won or lost; it was about the team’s evolving strategy, the star player’s impact, and the growing reliance on three-pointers.
In her quest for an unbiased story, Sasha remained cautious of her affinity for the game. She avoided the temptation to highlight data that praised the team and brushed over shortcomings. Instead, she objectively reported on the strengths and areas for improvement, adding credibility to her narrative.
The outlier game with the star player’s record-breaking score formed the peak of her story. She painted a vivid picture of the exceptional game, tying in the thrill and anticipation of the night with the player’s outstanding performance.
When Sasha presented her findings to the class, she created a compelling story woven from data threads. Her narrative encompassed the evolving tactics, the rise of the three-point trend, the adrenaline-charged outlier game, and even suggested areas for future improvement. The story wasn’t just about numbers on a page; it was a tale of the school’s basketball journey.
With the applause of her classmates ringing in her ears, Sasha realized she had successfully dunked into the captivating world of data storytelling, uncovering the hidden tale within the game statistics she knew so well. Through her love for basketball and her newfound passion for statistics, Sasha had made the numbers come alive in a truly memorable way.