Imagine for a moment you are making one of your favorite dishes. You’ve done it a hundred times, and you’re confident in the recipe. But this time, it’s for a special occasion, a grand party perhaps. As you taste-test the dish, it seems right, but you wonder – should you trust your taste buds? You decide to add a little extra seasoning just to be sure. Now, your friends and family love the dish, and your confidence paid off.
But what if it was a tad too salty? What if the extra seasoning you added, because you weren’t completely confident about your taste-test, had turned the dish into a disaster? Not a great feeling, right?
Now, let’s shift this scenario from your kitchen to a laboratory. Imagine you are a scientist or a researcher conducting an important test. Your findings can influence policy decisions, technological advances, medical treatments, or even the fate of a legal case. The pressure is immense. How confident should you be in your results before you share them with the world? Just like with your culinary creation, the implications of overconfidence or underconfidence could be catastrophic.
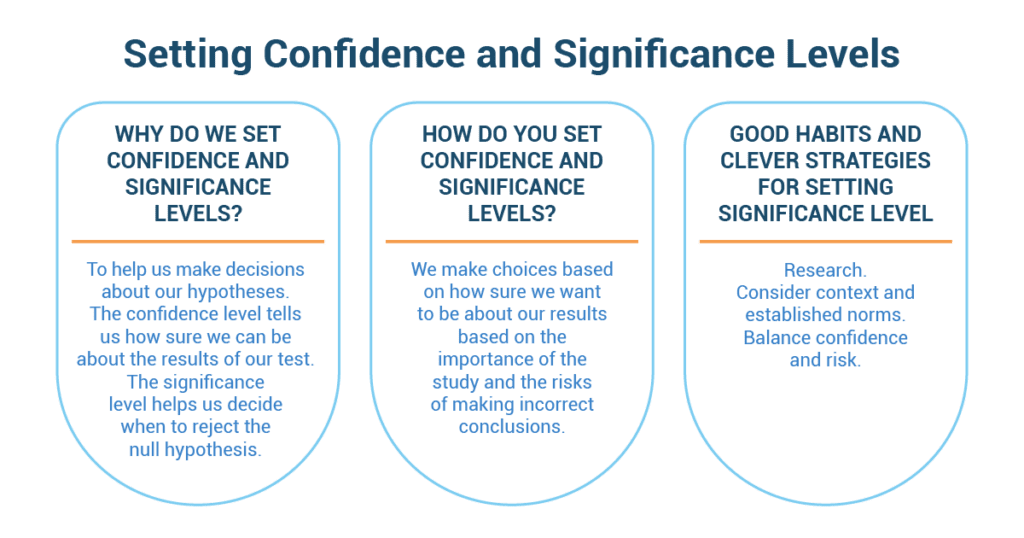
Why Do We Set Confidence and Significance Levels?
Just like a basketball game, we make decisions beforehand to control our chances of winning or, in statistics, drawing correct conclusions. When you set the confidence level and significance level, it’s like deciding how many baskets you need to make and how far you’re comfortable shooting from before you start the game.
Determining the significance level allows you to set a threshold for how strong your evidence should be, like deciding you’ll only take shots from 10 feet or closer. It’s about being confident but also taking risks.
Just like knowing the rules of basketball helps you play better, setting these levels upfront helps you understand your results better. It also discourages “p-hacking,” where you keep changing your test until you find a significant result. That’s like changing the game rules until you start winning, which isn’t really fair, right?
How Do You Set Confidence and Significance Levels?
Setting these levels is like preparing for the big game. You need to think about the risks of getting things wrong, like missing the basket, and consider the variability in your data, like your shooting accuracy from different distances.
The norms in your field, or the usual tactics of other basketball teams, can guide you. But don’t forget your own comfort level with uncertainty – how risky are you willing to play?
Lastly, keep your test’s power (how well your test can find a true effect) and your significance level (how often you’re okay with being wrong) in balance, like managing your energy and shooting accuracy in the game.
Good Habits and Clever Strategies for Setting Significance Level
Just like in basketball, there are strategies and good habits to follow. Set the significance level before you start gathering or analyzing data, just like deciding game strategies before stepping onto the court.
- Don’t just blindly follow what others usually do – choose your significance level based on your unique situation. That’s like choosing your shooting spot based on your skills, not others’.
- Decreasing the significance level will reduce the risk of false positives, but it increases the risk of a false negative.
- Avoid P-value fishing or “p-hacking,” like changing your strategy just to win the game. When you test a bunch of things at once, you’re more likely to get a “wow” result by sheer luck, like throwing a bunch of balls and hoping one will go in.
Lastly, perform a power analysis to figure out how many data points you need to spot an interesting result. It’s like figuring out how many shots you need to make to win the game. This analysis can help you determine the minimum sample size, like the minimum number of shots you need to win.
Ensuring Quality Consistency in Sardine Manufacturing
In the bustling coastal city of HarborBay, a renowned canned seafood company named “OceanCuisine” had earned a reputation for delivering high-quality products to seafood enthusiasts worldwide. However, a recent concern emerged regarding the consistency of their sardine manufacturing process. The Vice President of Quality Control, Sarah Reynolds, found herself grappling with the question of how confident they needed to be in the test results to ensure the quality of their sardines.
Sarah was a seasoned professional with years of experience in quality assurance. She was committed to upholding OceanCuisine’s reputation for excellence. The challenge of maintaining consistent sardine quality prompted her to delve into the realm of determining confidence levels for test results. Sarah’s team had been monitoring various quality parameters throughout the sardine manufacturing process. However, there was a debate within the team about how stringent the confidence levels should be for accepting or rejecting a batch of sardines. Sarah recognized that this decision was crucial to avoid both false positives (rejecting good batches) and false negatives (accepting subpar batches).
In a meeting with her team, Sarah likened confidence levels to a balance between risk and certainty. She drew parallels to a safety inspection at an airport, explaining that higher confidence levels meant fewer chances of missing a potential issue (lowering the risk of false negatives). However, as confidence levels increased, the threshold for accepting a batch would become more stringent, potentially leading to the rejection of batches that were actually of acceptable quality. To address the challenge, Sarah’s team compiled historical data on sardine batches that had undergone various quality tests. They categorized the batches into “Accepted” and “Rejected” based on subsequent evaluations of product quality.
Working closely with her team, Sarah performed a series of statistical analyses. She opted for a significance level of 5%, which corresponded to a confidence level of 95%. This meant that when test results were evaluated, OceanCuisine would be 95% confident in their decision – either accepting or rejecting a batch. Sarah emphasized that the chosen confidence level struck a balance between the risk of rejecting good batches and the risk of accepting subpar ones. While a higher confidence level would provide greater certainty, it could lead to unnecessary waste. Conversely, a lower confidence level might save batches but could potentially allow low-quality products to reach consumers.
OceanCuisine adopted the 95% confidence level as a standard practice for evaluating sardine quality. The company saw improvements in quality consistency as fewer batches that met the standards were rejected, reducing waste and production delays. As time passed, Sarah’s team continually monitored the results of their chosen confidence level strategy. They periodically reviewed the accepted and rejected batches to ensure that the approach was effective in maintaining quality while minimizing waste.
Conclusion:
In the world of sardine manufacturing, OceanCuisine showcased the importance of determining appropriate confidence levels for test results. Sarah Reynolds’ strategic decision-making, rooted in statistical analysis and risk assessment, allowed the company to strike a balance between quality consistency and operational efficiency. By understanding and applying confidence levels effectively, corporate professionals like Sarah played a pivotal role in upholding OceanCuisine’s commitment to delivering top-notch canned seafood to their discerning customers in HarborBay and beyond.