Imagine for a moment you are making one of your favorite dishes 🍲. You’ve done it a hundred times, and you’re confident in the recipe. But this time, it’s for a special occasion, a grand party perhaps 🎉. As you taste-test the dish, it seems right, but you wonder – should you trust your taste buds? You decide to add a little extra seasoning just to be sure. Now, your friends and family love the dish, and your confidence paid off.
But what if it was a tad too salty?🧂What if the extra seasoning you added because you weren’t completely confident about your taste-test had turned the dish into a disaster? Not a great feeling, right? 😬
Now, let’s shift this scenario from your kitchen to a laboratory.🔬Imagine you are a scientist or a researcher conducting an important test. Your findings can influence policy decisions, technological advances, medical treatments, or even the fate of a legal case. The pressure is immense. How confident should you be in your results before you share them with the world? Just like with your culinary creation, the implications of overconfidence or underconfidence could be catastrophic.
This is where the concept of ‘confidence in test results’ comes into play, a term you may not have thought about but subconsciously practice every day. We all deal with tests, be it testing a new recipe, testing a new route to work, or even testing a joke on a friend to see if it’s funny. And each time, we assess how confident we are in the results. 🤔💭
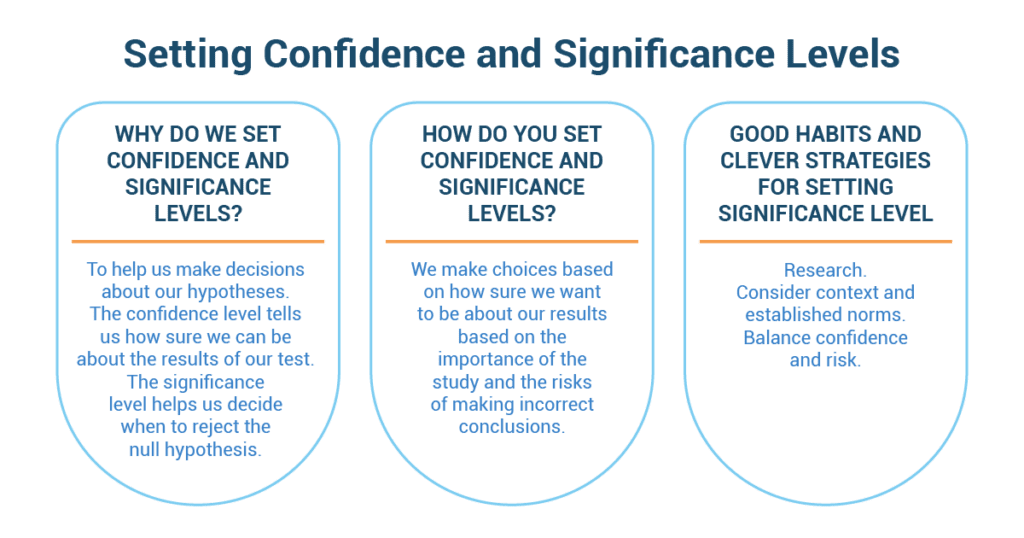
Why Do We Set Confidence and Significance Levels?
Just like a basketball game, we make decisions beforehand to control our chances of winning or, in statistics, drawing correct conclusions. When you set the confidence level and significance level, it’s like deciding how many baskets you need to make and how far you’re comfortable shooting from before you start the game.
Determining the significance level allows you to set a threshold for how strong your evidence should be, like deciding you’ll only take shots from 10 feet or closer. It’s about being confident but also taking risks.
Just like knowing the rules of basketball helps you play better, setting these levels upfront helps you understand your results better. It also discourages “p-hacking,” where you keep changing your test until you find a significant result. That’s like changing the game rules until you start winning, which isn’t really fair, right?
How Do You Set Confidence and Significance Levels?
Setting these levels is like preparing for the big game. You need to think about the risks of getting things wrong, like missing the basket, and consider the variability in your data, like your shooting accuracy from different distances.
The norms in your field, or the usual tactics of other basketball teams, can guide you. But don’t forget your own comfort level with uncertainty – how risky are you willing to play?
Lastly, keep your test’s power (how well your test can find a true effect) and your significance level (how often you’re okay with being wrong) in balance, like managing your energy and shooting accuracy in the game.
Good Habits and Clever Strategies for Setting Significance Level
Just like in basketball, there are strategies and good habits to follow. Set the significance level before you start gathering or analyzing data, just like deciding game strategies before stepping onto the court.
- Don’t just blindly follow what others usually do – choose your significance level based on your unique situation. That’s like choosing your shooting spot based on your skills, not others’.
- Decreasing the significance level will reduce the risk of false positives, but it increases the risk of a false negative.
- Avoid P-value fishing or “p-hacking,” like changing your strategy just to win the game. When you test a bunch of things at once, you’re more likely to get a “wow” result by sheer luck, like throwing a bunch of balls and hoping one will go in.
- Perform a power analysis to figure out how many data points you need to spot an interesting result. It’s like figuring out how many shots you need to make to win the game. This analysis can help you determine the minimum sample size, like the minimum number of shots you need to win.
Video Games and Hypothesis Testing
 Emily had been given a project to conduct a hypothesis test on a topic of her choice. She was a passionate gamer, spending most of her free time exploring digital realms and honing her skills in various video games. Naturally, she chose to delve into the world of video games for her project.
The topic of her project was “Do video games impact academic performance negatively?”. She had heard this claim numerous times, but she decided to put it to the test. For her project, she chose to work with a confidence level of 95%, a common choice in statistics as it balances the risks of false positives and negatives.
Emily began by gathering data. She conducted a survey within her school, targeting students from different grades and academic standings, and inquired about their video gaming habits. She then collected their GPA data from the school records, ensuring she had the necessary permissions and anonymizing it to maintain privacy.
Now, with the data in hand, she began to conduct her hypothesis test. Her null hypothesis was that video games did not negatively impact academic performance. The alternative hypothesis was the opposite: that video games did, in fact, negatively impact academic performance.
Running her numbers through statistical software, Emily found that her p-value was 0.03, lower than her significance level of 0.05, which she had determined based on her chosen confidence level of 95%. This result suggested that she should reject the null hypothesis. It implied that there was a statistically significant negative correlation between the hours spent playing video games and academic performance.
However, Emily knew that the p-value was only one piece of the puzzle. The practical significance was also important. Looking at the effect size, she realized that while the correlation was statistically significant, it was not practically significant. The difference in GPAs between students who played video games a lot and those who didn’t was minuscule.
Moreover, she also considered potential confounding variables that her study might have overlooked, such as the student’s innate talent, the home environment, study habits, etc. Emily understood that a correlation does not imply causation and reminded herself to interpret her results with caution.
Her final project concluded with the statement that while her hypothesis test suggested a statistically significant negative impact of video games on academic performance, the practical significance of the effect was minimal, and other factors not accounted for in her study might also be at play. Her teacher was impressed by Emily’s thoroughness, understanding of statistics, and the critical lens with which she analyzed her results. Emily felt confident that she had applied her statistical knowledge appropriately, despite her initial personal bias toward video games.