Imagine you’re at your favorite café on a busy morning. ☕📰 The air is filled with the delicious smell of coffee being made and the tempting aroma of freshly baked pastries. 🥐🍩Behind the counter, there are different baristas, each with their own special way of making coffee. Some pour the milk in a fancy way, while others focus on getting the water temperature and coffee grind just right. Even though they use the same ingredients, each cup of coffee they make tastes different and tells a story about who made it. That’s what makes your coffee experience there special, and it keeps you coming back for more.
Now, let’s think of data in the same way. Data is like that café, but instead of coffee, it’s a busy place where information comes together from many sources like the internet, 🌐 businesses, scientific research, 🔬 and even our own devices. 📱Just like each barista creates a unique cup of coffee, every piece of data has its own story and special traits. It might surprise you, but we are all data baristas, too!💡 Every time we click, search, or buy something online, we add to this huge collection of information.
In today’s world, data is not just boring numbers and facts. It’s like the lifeblood of decision-making, predicting things, and understanding our world better. Just like the special taste of a perfect cup of coffee, the value of data lies in its uniqueness. Exploring this uniqueness is not just for scientists or statisticians; it’s for all of us, as it affects our lives in ways we might not even know.
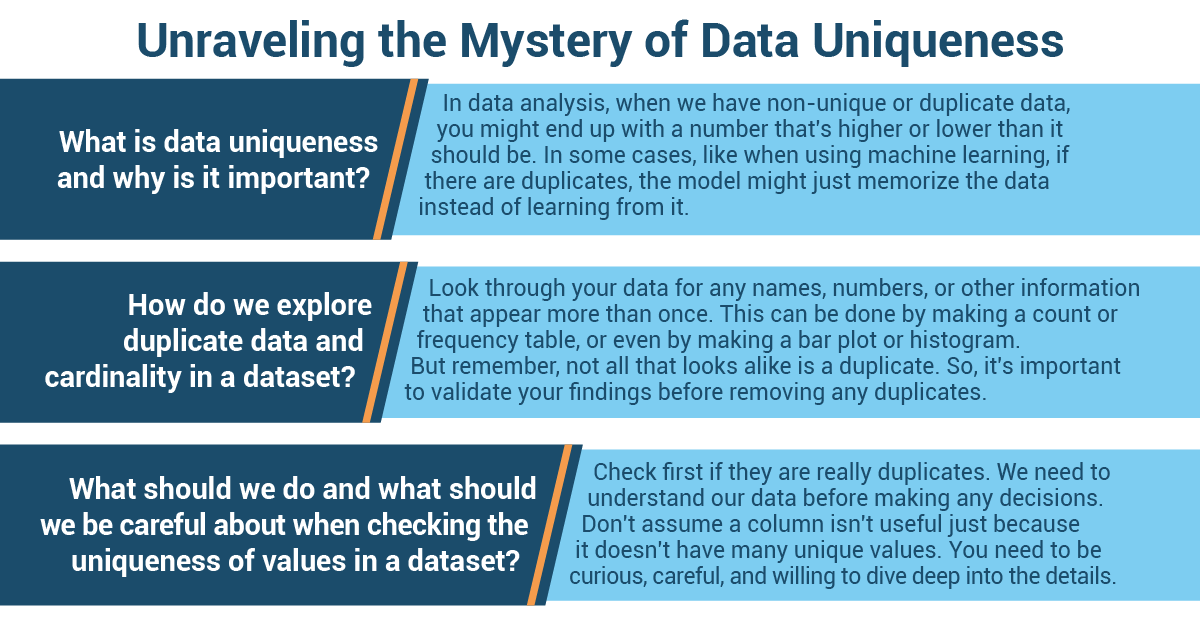
What is Data Uniqueness, and Why Is it Important?
Imagine you are working with a list of all the basketball players in your school, but some names appear more than once. If you’re trying to find out the average height, you might end up with a number that’s higher or lower than it should be. This could make your school’s basketball team seem taller or shorter than they really are! The same thing happens in data analysis when we have non-unique or duplicate data.
In some cases, like when using machine learning (think of it as a super-smart computer program that learns from data), if there are duplicates, the model might just memorize the data instead of learning from it. This is like memorizing the answers to a math test instead of learning how to solve the problems. This memorization won’t help when the model encounters new data, just like memorizing answers won’t help when you see new math problems!
- Data uniqueness means all data entries in a dataset are different, and no two are the same.
In data analysis, this means each data point is a unique observation.
- If our data isn’t unique, it can lead to biased results.
For example, if there are duplicates, the average, mode, and median can be skewed, providing a misleading understanding of the data.
- Duplicate data can cause overfitting in machine learning models.
The model might ‘memorize’ the training data instead of learning the underlying patterns. This affects the model’s ability to be applied to new data.
- If the data isn’t unique, we might need to clean it to remove duplicates.
This might lead to less data, affecting the power of any further analysis.
How Do We Explore Duplicate Data and Cardinality in a Dataset?
- Identify duplicates and cardinality
You might be wondering what ‘cardinality’ means. Well, in the world of data, cardinality refers to the number of different values in a dataset. For instance, in a dataset about our school’s basketball team, the cardinality of ‘Player Names’ would be the number of different player names.
Here’s what you can do: Start by looking through your data for any names, numbers, or other information that appear more than once. This can be done by making a count or frequency table or even by making a bar plot or histogram.
- Validation
After we identify potential duplicates, we need to check if they are true duplicates or just similar data points. We need to see if high or low cardinality is expected or acceptable based on the nature of the data and the type of analysis. Pairwise comparison and domain-specific rules may help you.
But remember, not all that looks alike is a duplicate. Sometimes, the same information might show up more than once for different reasons. For example, there might be two students with the same name on the basketball team. They seem like duplicates, but they aren’t. So, it’s important to validate your findings before removing any duplicates.
- Handling
Depending on the validation step, deal with the duplicates. This could be by removing them, marking them, or deciding to keep them if they’re not true duplicates. Depending on the evaluation step, handle the high or low cardinality features appropriately. One approach might be to group values.
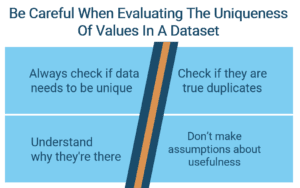
What Should We Do, and What Should We Be Careful about When Checking the Uniqueness of Values in a Dataset?
- Always check if data needs to be unique.
Some variables may naturally have duplicates, and that’s okay.
Not all fields are meant to be unique. For example, an ‘Education’ field will have duplicates because there are limited categories (e.g., High School, Associates, Bachelor’s, etc).
Let’s go back to our basketball team. Let’s say we have a ‘Position’ column. We know that many players can have the same position, like ‘forward’ or ‘guard.’ So, duplicates in this column are okay and expected.
- In the case of duplicate records, check if they are true duplicates or if they indicate separate instances that happened to be the same.
Sometimes, what seems like a duplicate might not actually be a duplicate. It’s important to understand our data.
If you find a student’s name appearing more than once, don’t be too quick to erase it. Check first if they are really duplicates or just students with the same name. In short, we need to understand our data before making any decisions.
- Don’t remove all duplicate records without understanding why they’re there.
If you remove duplicate records, you may lose important data.
Find out why duplicates are there. Sometimes, duplicates are a result of data collection errors, but they can also be legitimate data points.
- Don’t assume that a low number of unique values (low cardinality) in a column means it isn’t useful.
This may lead to overlooking important variables.
Even a column with low cardinality can be important. It’s the context and relationship with the target variable that defines the usefulness of a feature, not its cardinality alone.
For instance, a ‘Grade Level’ column will only have a few unique values (9th, 10th, 11th, 12th), but it’s still important information, right? Remember, even if a column doesn’t have many different values, it can still be significant.
A Tale of Taming Data: Chris and the Enigma of Academic Excellence
 It was the summer before senior year, and Chris was eagerly awaiting the challenge of his final year at Westlake High. Known for his logical mind and curiosity, he was determined to find the answer to a question that had always puzzled him: What truly determines academic success?
Chris began his mission by collecting data from various sources: school records, online databases, student surveys, and more. His dataset included variables such as student GPAs (Grade Point Average), standardized test scores, attendance rates, library usage, number of hours spent studying, participation in extracurricular activities, and even the average hours of sleep per night. He meticulously compiled all this data into a comprehensive spreadsheet.
As Chris delved into the data, he quickly realized that to find meaningful insights, he needed to ensure that his data was clean and unique. He noticed that there were repeated names in his dataset. Chris paused, recalling a lesson from his Statistics class about the importance of data uniqueness. Without it, his analysis could lead to biased results, thus failing to unveil the true factors of academic success.
Chris began by isolating the duplicate entries for further examination. After cross-referencing with other variables, such as grade level and subjects, he discovered that some of the duplicates were not errors at all but simply students who shared the same name. However, others were indeed true duplicates, likely from data collection errors. He marked the valid duplicates and removed the errors, maintaining the integrity of his dataset.
He then analyzed the cardinality of his features. He realized that while some variables, like ‘Subjects,’ had high cardinality with many unique values, others, like ‘Grade Level,’ had low cardinality. Yet, he remembered that low cardinality didn’t necessarily mean these variables were unimportant. After all, a student’s grade level could potentially have a significant impact on academic performance.
As he dug deeper, he realized that some students had identical numbers of extracurricular activities. Initially, he marked these as duplicates, but upon closer inspection, he understood these were valid data points. After all, it wasn’t improbable for different students to participate in the same number of activities.
His careful exploration of data uniqueness revealed a complex network of variables that contributed to academic success. No single factor dominated, but a balanced combination of study hours, participation in extracurricular activities, and a healthy sleep schedule emerged as a common thread amongst the top performers.
Chris presented his findings at the school assembly, highlighting how understanding and considering data uniqueness had led him to these insights. The students and teachers applauded Chris’s meticulous investigation, but they cheered even louder for his conclusion: there is no single path to academic success, just as there is no single, unique piece of data that determines it.
In his pursuit of academic excellence, Chris had not only provided valuable insights to his school but also learned a critical lesson himself: in data, just as in life, uniqueness matters.