Picture this: You are deciding which ice cream flavor to pick at the ice cream store. There are so many options – chocolate, strawberry, vanilla, and so much more. How do you decide? You might think about which flavor you enjoyed the most last time or which one your friends recommend. Guess what? You’re doing something really smart without even knowing it – you’re using something like statistical modeling!
Now, you might be scratching your head and asking, “What? Me, using something fancy like statistical modeling just to pick ice cream?” That’s right! Whenever we use the information to help make decisions, we’re sort of being like detectives with data!
But why should we care about getting better at this? Why is it important to understand analysis and statistical modeling? Well, imagine if you could get even better at making these types of decisions and feel even more sure that you made the right choice.
Today, we’re going on an adventure. We’re going to look at how statistical modeling isn’t just some big, complicated idea for scientists in lab coats, but it’s something that can help all of us make better decisions.
Analysis and statistical modeling are the very heart of the statistical investigative process.
When we collect data, it’s like gathering a bunch of numbers or information. But just having the data isn’t enough. We need to analyze it and use statistical models to uncover patterns, relationships, and important information hidden within the numbers.
Analysis is like examining the data closely and looking for interesting things. We can calculate averages, make graphs, or compare different groups to see if there are any differences or similarities. It helps us organize and summarize the data so we can understand it better.
Overview of process
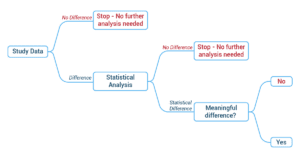
Understanding the statistical analysis process will help support decisions about what type of analysis is needed. The following decision-tree demonstrates how to use data to determine how much analysis is needed and why.
The stages of analyzing data
Step 1: Choosing the Right Analysis Method: The first step is selecting an appropriate statistical method for analysis. This choice depends on various factors, including the type of data, the research question, and the nature of the study. Additionally, it is necessary to Identify the condition that must be accepted as true before a statistical analysis can be carried out to ensure the validity and reliability of the analysis, these are called statistical assumptions. They establish the necessary requirements for applying a specific statistical method or test.
- A Chi-square compares data that is group data, also known as nominal data.
- A T-test, or difference of means test, compares two different groups, but this time, the variable we are interested in is a continuous variable.
- A correlation test is a way to see how two things are related. It measures how closely the numbers of two things go together or change together. For example, we are interested in whether the number of minutes spent playing video games is related to the number of minutes spent preparing presentations.
These statistical methods and others are used to test the hypothesis so the researcher can make inferences and draw conclusions about a population based on sample data. A key output of these statistical methods is probability, also known as a p-value.
- Chi-square, to test whether certain employees have significantly higher or lower rates of using social media for professional networking. Let’s consider two examples:
- Example 1: Here, there is no difference between responses from departments A and B, so we can stop
- Example 2: Here, we can see there is a difference, so we should run a Chi-square test to see if it is a statistically significant difference.
- T-test, duration of video game playing among employees who engage in physical activities (e.g., fitness programs, sports) and those who don’t.
Step 3: Checking Assumptions: All statistical methods come with certain assumptions. For example, a t-test assumes a normal distribution, while regression analysis assumes a linear relationship between variables. It’s important to understand these assumptions when interpreting the results.
Step 4: Interpreting Outputs: The final step in the analysis stage is interpreting the outputs of the statistical test or model used. This could involve determining statistical significance, identifying key variables, or predicting outcomes.
Enhancing Product Reliability through Data-Driven Analysis
In the realm of cutting-edge engineering, “InnovateTech” stood as a pioneering company known for its innovative solutions and groundbreaking advancements. The company’s Lead Engineer, Michael Turner, found himself at a crossroads of innovation and precision. Michael’s challenge was to ensure that the company’s latest product design not only met industry standards but also excelled in reliability. To tackle this challenge, he embarked on a journey of data-driven analysis, recognizing its pivotal role in transforming designs into dependable engineering marvels.
Michael was an experienced engineer with a passion for pushing the boundaries of design. The challenge of marrying innovation with reliability in their latest project prompted him to embrace the power of data analysis. His goal was not just to create cutting-edge products but also to ensure they were built on a foundation of rigorous analysis and dependability. InnovateTech’s latest project aimed to revolutionize energy-efficient motors for industrial use. The challenge was twofold – designing a product that exceeded performance expectations while guaranteeing long-term reliability. Michael realized that data-driven analysis was the compass that would guide them through this intricate journey.
In a brainstorming session with his engineering team, Michael compared data analysis to exploring uncharted territory. He explained that each piece of data was like a map, guiding them through the complexities of design choices. Just as explorers navigated landscapes, engineers navigated design spaces with analysis as their compass. Michael’s team strategically collected data throughout the design process. They recorded specifications, stress-test results, and performance metrics for various prototypes. Additionally, they scrutinized historical performance data from similar products to gather insights.
With a trove of data amassed, Michael’s team employed statistical techniques to unveil insights. They identified correlations between different design elements and product reliability. They also simulated real-world scenarios to gauge performance under stress. Armed with analysis insights, Michael and his team iteratively refined the product design. They identified weak points and bolstered them, optimizing the design for both performance and reliability.
As prototypes evolved, Michael’s team subjected them to rigorous testing. They compared real-world test results with their analysis predictions, validating the accuracy of their models and ensuring that the design improvements translated into tangible outcomes. In the end, InnovateTech’s new energy-efficient motors dazzled not only in performance but also in reliability. Thanks to the data-driven analysis approach, the team had crafted products that were both groundbreaking in their innovation and unyielding in their reliability.
Conclusion:
In the dynamic world of engineering, InnovateTech showcased the pivotal role of data-driven analysis in turning designs into dependable marvels. Michael Turner’s strategic approach allowed the company to blend ingenuity with precision, creating products that didn’t just promise excellence but delivered it consistently. By embracing data analysis as a guiding force, corporate professionals like Michael shaped industries, driving innovation and dependability, and propelling companies toward engineering excellence and success.