Picture this: You are deciding which ice cream flavor 🍦 to pick at the ice cream store. There are so many options – chocolate 🍫, strawberry 🍓, vanilla, and so much more. How do you decide? You might think about which flavor you enjoyed the most last time or which one your friends recommend 🤔. Guess what? You’re doing something brilliant without even knowing it – you’re using something like statistical modeling!
Now, you might be scratching your head 🧐 and asking, “What? Me, using something fancy like statistical modeling just to pick ice cream?” That’s right! Whenever we use the information to help make decisions, we’re sort of being like detectives with data! 🕵️♂️
But why should we care about getting better at this? Why is it important to understand analysis and statistical modeling? Well, imagine if you could get even better at making these types of decisions and feel even more sure that you made the right choice.
Today, we’re going on an adventure. We’re going to look at how statistical modeling isn’t just some big, complicated idea for adults in lab coats, but it’s something that can help all of us make better decisions.
So, whether you’re trying to figure out which video game 🎮 is the best, which sports team 🏀 is most likely to win the game, or which school subject 📚 you’re really the best at, understanding how to think like a data detective can help you make smarter choices. We’re going to dive into the fun world of data and see how analyzing it can help clear up confusion. Let’s take a journey into the cool world of statistical modeling in our everyday lives. Ready for the adventure? Let’s go!
Analysis and Statistical Modeling are the Very Heart of the Statistical Investigative Process
When we collect data, it’s like gathering a bunch of numbers or information. But just having the data isn’t enough. We need to analyze it and use statistical models to uncover patterns, relationships, and important information hidden within the numbers.
Analysis is like examining the data closely and looking for interesting things. We can calculate averages, make graphs, or compare different groups to see if there are any differences or similarities. It helps us organize and summarize the data so we can understand it better.
How to Analyze Data Overview
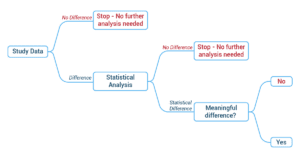
Understanding the statistical analysis process will help support decisions about what type of analysis is needed. The following decision tree demonstrates how to use data to determine how much analysis is needed and why.
Now, let’s take a deeper look at the stages of analyzing data:
Step 1: Choosing the right analysis method
The first step is selecting an appropriate statistical method for analysis. This choice depends on various factors, including the type of data, the research question, and the nature of the study. Additionally, it is necessary to Identify the condition that must be accepted as true before a statistical analysis can be carried out to ensure the validity and reliability of the analysis; these are called statistical assumptions. They establish the necessary requirements for applying a specific statistical method or test.
Let’s consider a few different options of statistical models that we might use to give different types of data and research questions:
- A Chi-square compares data that is group data, also known as nominal data.
Let’s say we are interested in whether students at different grade levels are more likely to have social media accounts. So, we would group participants by grade level and then split them by yes or no on social media accounts. The chi-square will test whether certain grades have significantly higher or lower rates of social media accounts.
- A T-test, or difference of means test, compares two different groups, but this time, the variable we are interested in is a continuous variable.
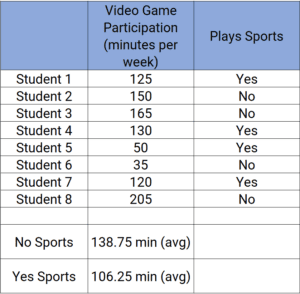
Example: To determine if there is a significant difference between the minutes of video games played in a day for students who play a sport and those who do not.
- A correlation test is a way to see how two things are related. It measures how closely the numbers of two things go together or change together. For example, we are interested in whether the number of minutes spent playing video games is related to the number of minutes spent studying.
These statistical methods and others are used to test the hypothesis so the researcher can make inferences and draw conclusions about a population based on sample data. A key output of these statistical methods is probability, also known as a p-value.
Step 2: Applying the chosen method
Once an appropriate method is chosen, it’s time to apply it to the data. This application could involve calculating measures of central tendency for descriptive statistics or building models in regression analysis. This step transforms raw data into a form that can be interpreted and understood. Here are examples of how to apply two different methods:
- Chi-square, to test whether certain grades have significantly higher or lower rates of social media accounts. Let’s consider two examples:
- Example 1: Here, there is no difference between responses from grade 10 and grade 11, so we can stop
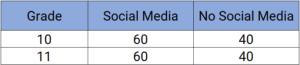
-
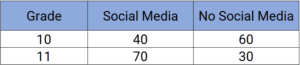
- Example 2: Here, we can see there is a difference, so we should run a Chi-square test to see if it is a statistically significant difference.
- T-test, to compare the minutes of video games played daily for students who play a sport and those who do not. You see that the mean (average) time for all students who play and do not play sports is identified at the bottom of the table.
Step 3: Checking assumptions
All statistical methods come with certain assumptions. For example, a t-test assumes a normal distribution, while regression analysis assumes a linear relationship between variables. It’s important to understand these assumptions when interpreting the results.
Step 4: Interpreting outputs
The final step in the analysis stage is interpreting the outputs of the statistical test or model used. This could involve determining statistical significance, identifying key variables, or predicting outcomes.
The role of analysis in the statistical investigative process is monumental. It ensures that the data we have painstakingly collected and processed is put to good use – answering the questions we set out to address. It’s the key to unlocking insights and fostering understanding from an otherwise bewildering array of data.
Case Study – Social Media and Grade Level
 Fatima, a high school junior, was part of her school’s student council. She noticed something interesting. The freshmen were always buzzing about the latest trends on TikTok, while the seniors seemed more engaged in discussions about LinkedIn and college admissions. This made her wonder if there was a pattern to how social media usage varied across different grade levels at her school.
A few weeks later, during her Statistics class, Fatima learned about statistical modeling. An idea sparked in her mind: what if she could use what she learned to make sense of her observation?
Fatima decided to conduct a survey across the school to gather data. She asked each student about their grade level and which social media platforms they used regularly. Gathering all this data, Fatima was ready to step into the world of statistical analysis.
She first organized her data in a simple table, with grade levels as rows and social media platforms as columns. Then, she decided to use a Chi-square test, which she had learned could be used to understand if two categorical variables, like grade level and social media preference, were related.
After conducting the Chi-square test, she interpreted the results. To her excitement, the p-value was less than 0.05, suggesting there was a significant relationship between grade level and the type of social media platform used.
Fatima’s finding was not just about understanding social media trends in her school; it was about much more than that. It was about being able to take a question, apply statistical methods, interpret the results, and make meaningful conclusions.
In a school assembly, Fatima shared her findings. Her peers were fascinated not just by the insights about social media but also by the method she used. Even the freshmen were excited about how statistics could be applied in a relatable context!
Through this process, Fatima discovered that analysis and statistical modeling were not just concepts in her textbook but powerful tools that could help answer intriguing questions about the world around her.