Determining a proper research question is like setting sail on a grand adventure. It’s the compass that points us in the right direction, guiding our pursuit of knowledge and unveiling the secrets that lie hidden. Asking the right question is crucial because it shapes our entire journey, influencing the path we take and the answers we seek.
Like a compass guiding the way 🧭, a well-crafted question directs the researcher’s efforts, ensuring that the study’s objectives are clear and relevant. It serves as the foundation upon which data is collected, analyzed, and interpreted, influencing the choice of methodologies and guiding the researcher toward meaningful insights. A thoughtfully posed question allows for focused exploration, unveiling hidden patterns, exposing relationships, and advancing our understanding of the world. Conversely, a poorly formulated question can lead to ambiguity, wasted resources, and inconclusive results, leaving both researchers and society yearning for answers that remain frustratingly elusive. Thus, in the realm of statistical studies, the right question holds the key to unlocking the doors of knowledge and paving the way for impactful discoveries.
Think about it. Have you ever wondered why some plants thrive in certain environments while others struggle? 🌱🌞 Have you ever pondered what makes your favorite song so captivating? 🎵🤔 These are all questions that spark curiosity and push us to explore, just like in a research study. By asking the right research question, we open doors to new insights, deepening our understanding of the world around us.
Crafting a Research Question
But here’s the thing: crafting a research question isn’t as simple as picking an item from a menu. It requires careful thought and consideration. It’s like solving a puzzle, where each piece contributes to the bigger picture. A well-crafted research question captures the essence of our curiosity, guiding us toward the heart of the matter.
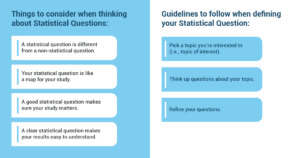
- A statistical question is different from a non-statistical question
When we ask a statistical question, we’re not just looking for a simple answer. We want to study and understand how things vary within a group. Statistical questions involve analyzing data to find patterns, relationships, and differences. Unlike non-statistical questions, which often have straightforward answers, statistical questions require data to provide meaningful insights. - Your statistical question is like a map for your study
A well-designed statistical question acts as a roadmap for your study. It helps you plan what data you need to collect and guides you in analyzing and interpreting that data. By having a clear question, you can stay focused, organized, and achieve valuable results in your study. - A good statistical question makes sure your study matters
Choosing a statistical question that is important not only to you but also to others makes your study significant. By addressing meaningful questions, you contribute to knowledge and provide insights that are helpful and interesting to a broader audience. This way, your study has a real impact. - A clear statistical question makes your results easy to understand
When your statistical question is well-defined, it leads to clear and understandable results. By stating exactly what you want to find out, others can easily grasp and comprehend your findings. A clear question helps in effective communication and enhances the understanding of the implications of your research.
Guidelines for Defining Your Question
- Pick a topic you’re interested in (i.e., topic of interest)
Select a topic that sparks your curiosity and aligns with your areas of interest. A genuine interest in the subject matter will fuel your motivation and engagement throughout the research process. - Think up questions about your topic
Generate a list of questions related to your chosen topic. Begin with broad questions and then gradually narrow them down to those that can be answered using data. This iterative process allows you to refine and focus your research question. - Refine your questions
Evaluate your questions to ensure they are specific, important, and relevant to your study. Consider seeking feedback from peers, mentors, or subject experts to gain different perspectives and improve the clarity and quality of your questions.
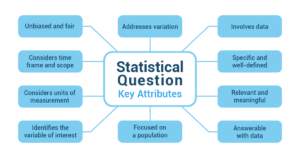
Key Attributes that Make a Statistical Question Effective and Suitable for Research
- Addresses variation: A good statistical question focuses on understanding the variation within a population or between different groups. It seeks to explore patterns, differences, or relationships in data.
- Involves data: A statistical question requires the collection and analysis of data to find meaningful answers. It goes beyond subjective opinions or personal anecdotes and relies on empirical evidence.
- Specific and well-defined: A good statistical question is clear, concise, and well-defined. It leaves no room for ambiguity or confusion and provides a precise direction for the research study.
- Relevant and meaningful: The question should be relevant and have significance in the bigger picture. It should address a problem, fill a gap in knowledge, or help us understand something better.
- Answerable with data: A good statistical question can be answered by collecting and analyzing data. It’s possible to get the necessary information and draw valid conclusions. If you can’t collect the needed data, you may need to change your question.
- Focused on a population: The question specifies the group of people or things being studied. It narrows down the focus to make sure the findings are relevant to that specific group.
- Identifies the variable of interest: A good statistical question identifies the specific thing or characteristic being studied. It tells us what aspect of the group we want to measure, compare, or explore.
- Considers units of measurement: If the thing being studied can be measured with numbers, the question should say how that will be done. It tells us what units or scales will be used to measure it.
- Considers time frame and scope: The question thinks about the time period and place of the study. This helps set boundaries and gives context to the research.
- Unbiased and fair: A good statistical question doesn’t favor one answer over another. It allows for fair and impartial analysis. It considers all possibilities and perspectives.
By incorporating these elements into the development of a statistical question, researchers can ensure that their study is focused, meaningful, and capable of generating valuable insights from data analysis.
How to Avoid Mistakes and Make the Best Research Questions for Your Statistical Investigation
- No fuzzy questions: It’s important to avoid fuzzy or unclear questions that make it difficult to gather the necessary data or decide how to analyze it. Make sure your research question is detailed and provides a clear direction for your study.
○ Fuzzy question: “What do students think about the school?”
○ Non-fuzzy question: “What is the overall satisfaction level of 10th-grade students regarding the school’s extracurricular activities?”
In this revised version, the question specifies the target group (10th-grade students), the aspect of the school (extracurricular activities), and the information sought (overall satisfaction level). This makes the question clearer and provides a specific focus for data collection and analysis. - Do not forget about variation: A good statistical question looks closely at how things are different, related, or connected within a group of people or things. It wants to find patterns or differences that can be discovered by studying data. If researchers don’t pay attention to these differences, they might ask questions that are too general and miss important details. This can make the results unfair or incomplete, making the study less reliable and helpful.
- Question without variation: “What is the temperature?”
- Question with variation: “How does the temperature vary throughout the year in different regions of the world?”
- Think of many questions: Do not settle for the first question that comes to mind. Think of multiple questions related to your topic and explore various angles. By considering multiple perspectives, you can select the most promising research question for your investigation.
- Ensure fairness (avoid bias): Try to avoid asking questions that could make you prefer a certain answer or viewpoint. It’s important to stay fair and objective in your research question so you can consider all the different possibilities. This helps you analyze the data in a complete and unbiased way without any favoritism.
○ Biased question: “Do you agree that smartphones are ruining the younger generation?”
○ Fair question: “What are the effects of smartphone usage on the younger generation?”
The original question seems to have a biased view against smartphones and assumes they have a bad influence on young people. It may influence people to answer in a specific way. The revised question, on the other hand, removes the bias by asking about the effects of smartphone usage without assuming they are negative. This lets us explore both the good and bad effects and consider different opinions. We can then look at various outcomes, like how smartphones affect social interactions, school performance, mental health, and overall well-being. This approach allows us to have a fair analysis without any preconceived ideas.
Designing a Statistical Question to Understand the Impact of Video Games on Academic Achievement
 Emily has a keen interest in video games and wondered how they might affect students’ academic performance. She decided she wanted to investigate this relationship using a statistical investigation—exploring the relationship between the amount of time students spent playing video games and their grades.
Emily knew that to conduct a successful investigation, she needed to develop a well-focused and meaningful research question. She followed a set of guidelines that would help her generate valuable insights from her data analysis.
First, Emily picked the topic of video games and academic performance. She was genuinely interested in understanding how these two aspects might be connected.
Next, she began to think up questions related to her chosen topic. Emily wondered if playing video games affected students’ grades. She pondered how the amount of time spent playing video games related to academic performance. She even considered whether there were differences in grades between students who played video games and those who did not. Additionally, Emily wondered if there was a correlation between the number of hours spent playing video games and a student’s Grade Point Average (GPA).
Emily understood the importance of refining her questions to make them effective statistical questions. She sought feedback from her teacher, who provided valuable insights. Together, they evaluated her questions and concluded that question # 2—about the relationship between the amount of time spent playing video games and academic performance—was specific, important, and relevant to her study.
To ensure fairness and avoid bias in her investigation, Emily took another important step. She rephrased her research question to remove any preconceived ideas. Her new question became: “What is the relationship between the amount of time spent playing video games and academic performance among 10th-grade students?”
By carefully following these guidelines, Emily successfully developed a statistical question that highlighted the importance of considering the question before starting a statistical study. Her question focused on a specific population (10th-grade students), involved data analysis, was specific and well-defined, and considered the units of measurement (time spent playing video games and academic performance). Most importantly, Emily’s research question avoided bias by not assuming whether video games had a positive or negative impact on academic performance.
Now equipped with her well-crafted research question, Emily was ready to collect data, analyze it, and draw conclusions based on her statistical investigation. Exciting adventures and valuable discoveries awaited her on this incredible journey of exploration and knowledge.