In this article, we’ll be discussing common ways to classify chart types and the limits of these classifications. As you know, charts are a fantastic way to visualize data and make it more understandable. You’ve probably seen them in news articles, blog posts, or even on social media.
There are several ways to classify chart types, and we’ll dive into some of the most common ones.
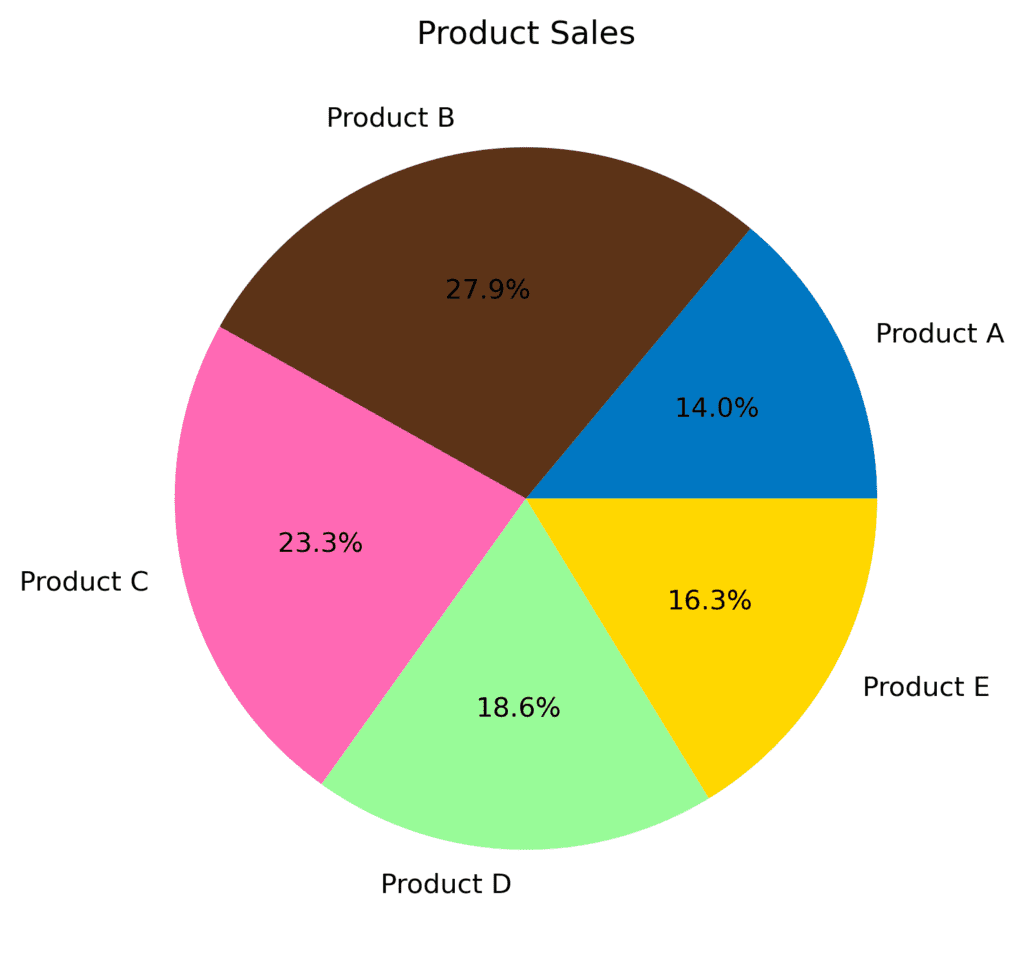
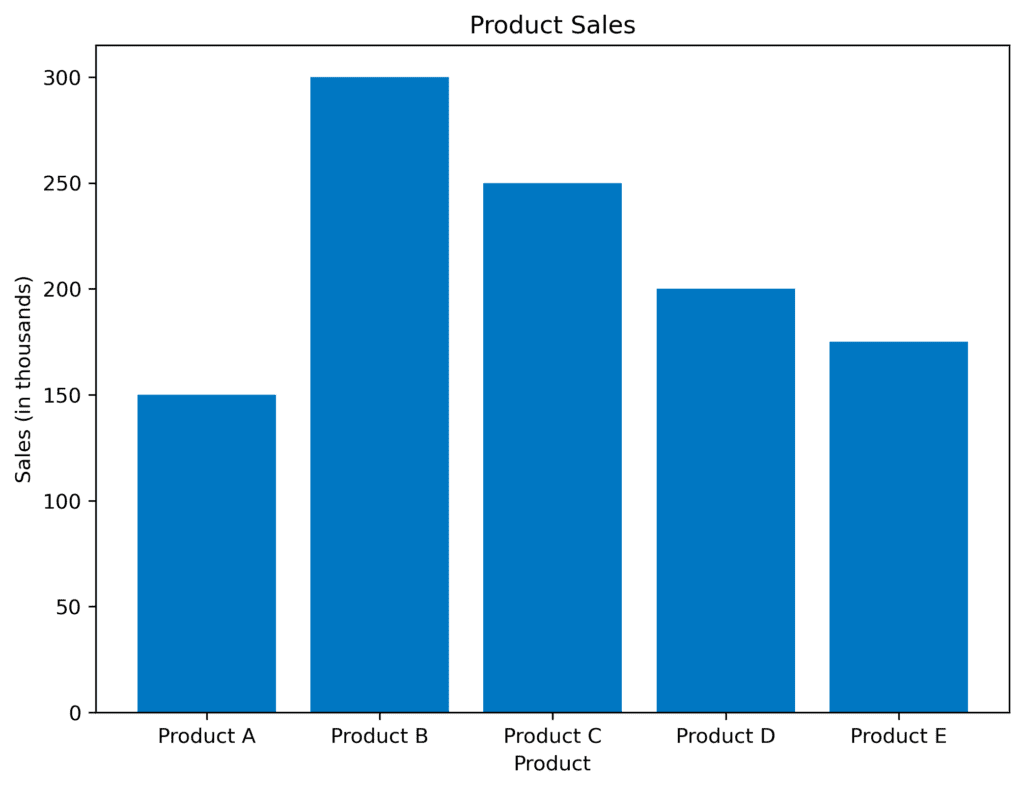
Comparison Charts
These charts help you compare different categories or data points. For instance, a bar chart is great for showing the sales of different products, while a pie chart can show the percentage of total sales that each product represents. Imagine you’re reading a news article comparing the popularity of different smartphone brands – a bar chart would be perfect for visualizing this.
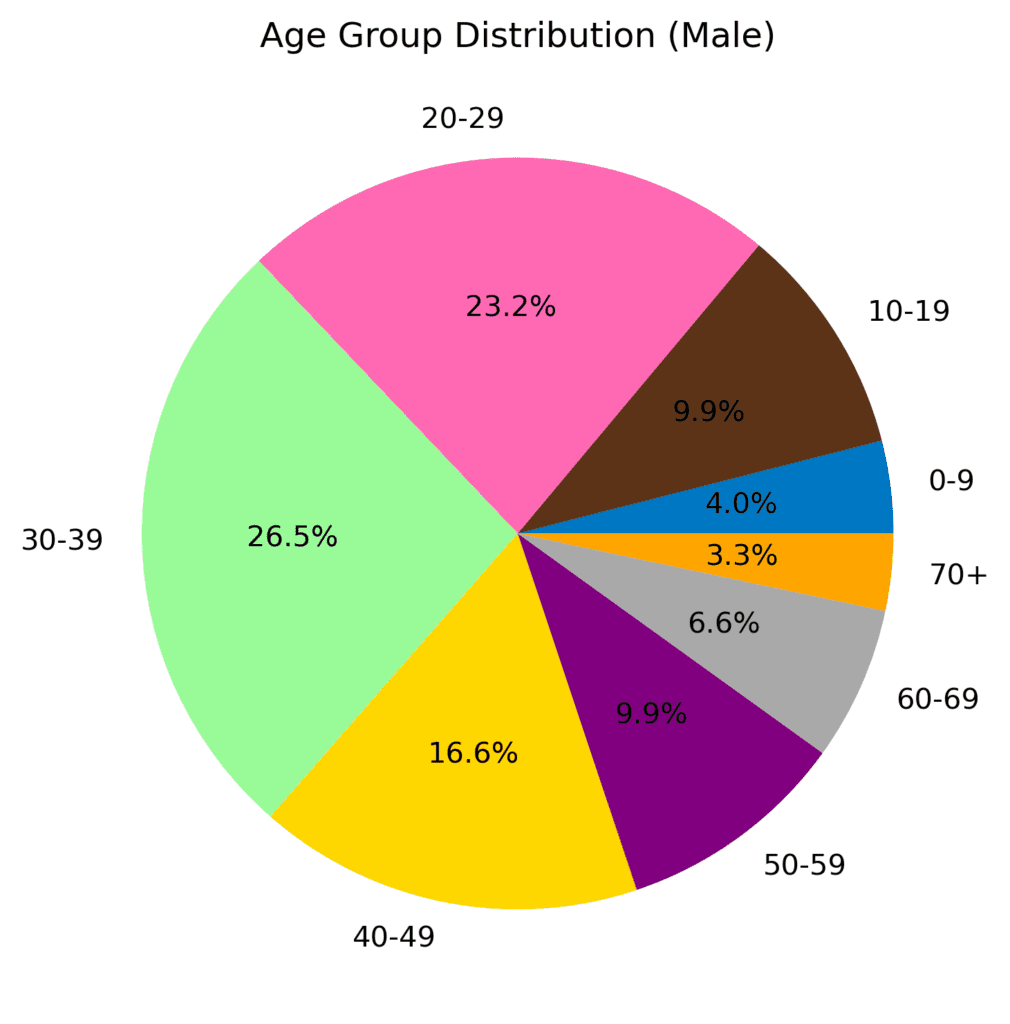
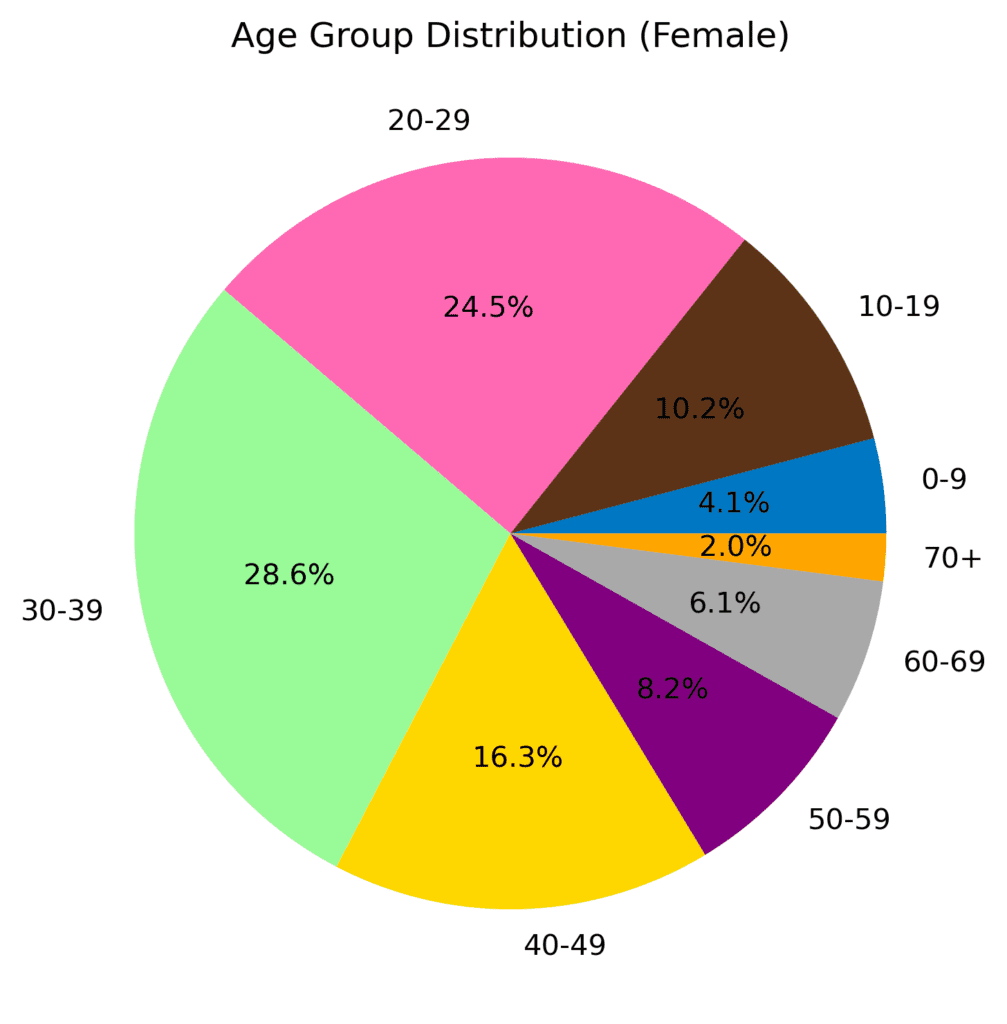
Composition Charts
Composition charts are useful when you want to break down a whole into its parts. For example, a stacked bar chart or a pie chart can show the distribution of various age groups in a population. Imagine you’re scrolling through social media and see a pie chart showing the composition of a music festival audience by age – that’s a composition chart in action. 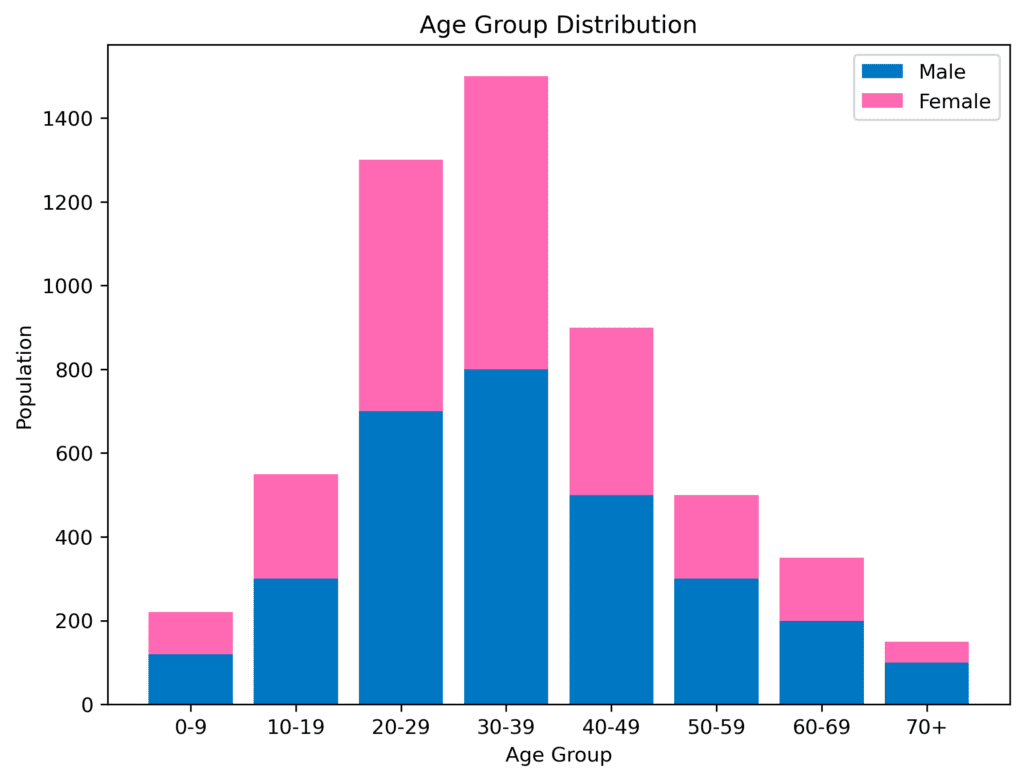
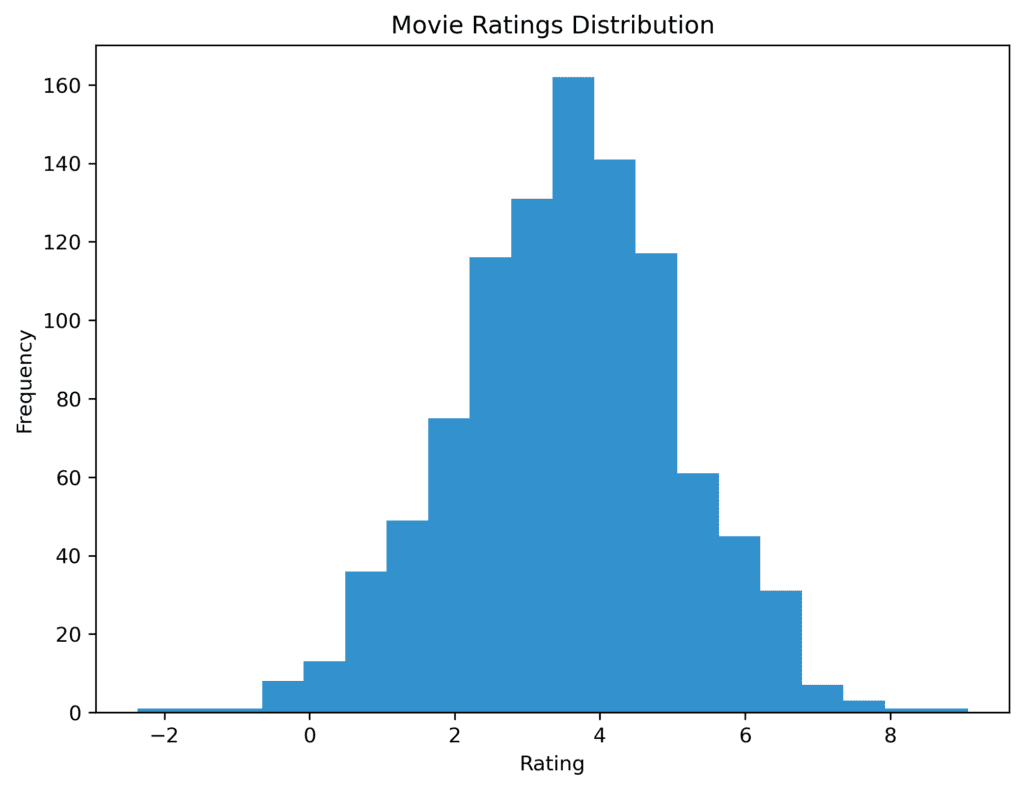
Distribution Charts
These charts help you understand a dataset’s range and distribution of values. A common example is the histogram, which shows the frequency of values within specified intervals. Imagine a blog post discussing the distribution of movie ratings on a popular streaming platform – a histogram would be perfect for visualizing this data.
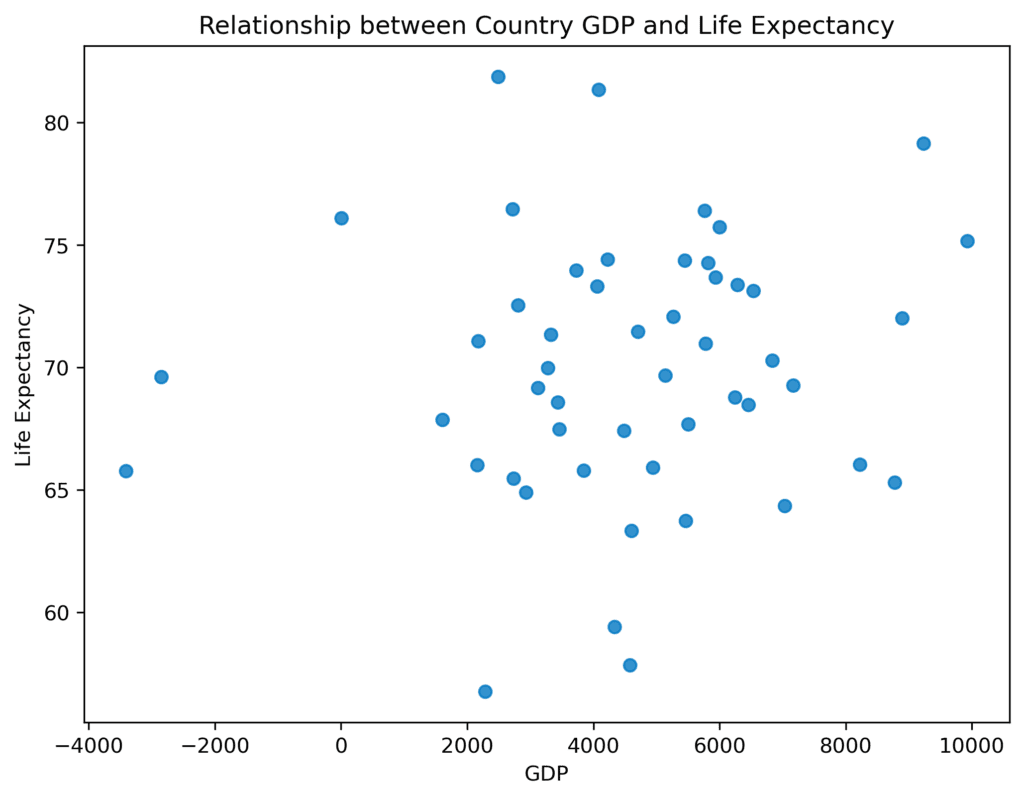
Relationship Charts
Relationship charts come in handy when you want to explore the correlation or relationship between two or more variables. Scatter plots and bubble charts are popular examples of this type of chart. For example, a scatter plot would be a fantastic way to visualize this data if you’re reading a news article about the relationship between a country’s Gross Domestic Product (GDP) and life expectancy.
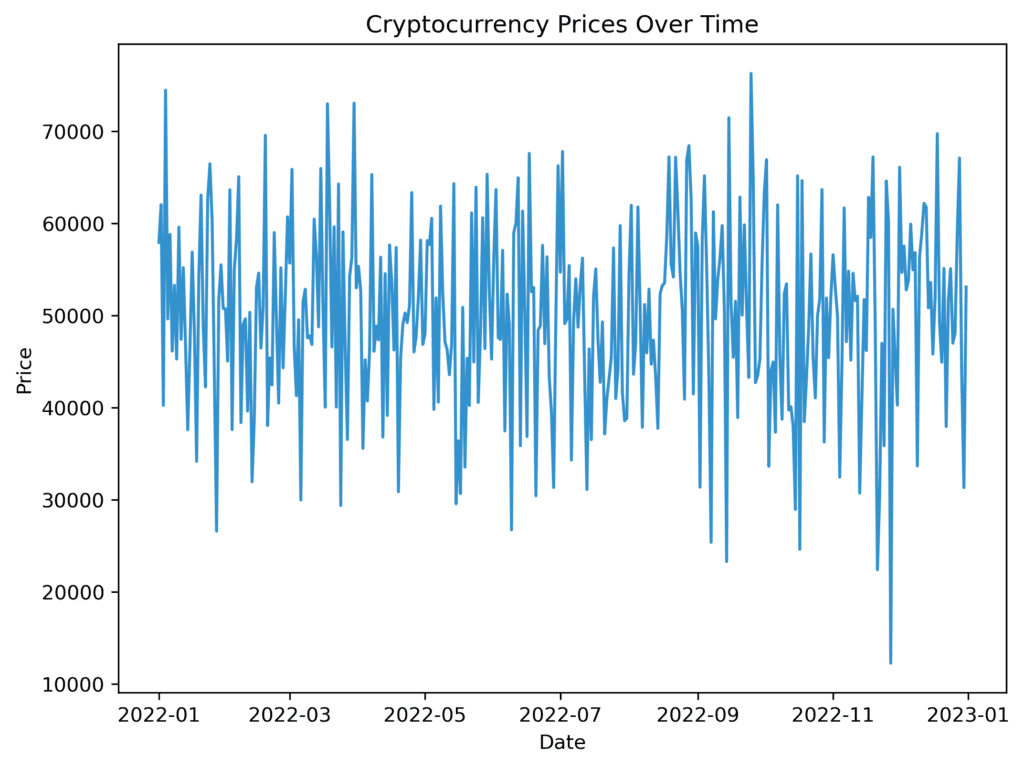
Time Series Charts
These charts help you track changes over time. Line charts and area charts are common examples, as they can show trends and fluctuations. If you’re reading a blog post about the rise and fall of cryptocurrency prices over the past year, a line chart would be perfect for showing this information.
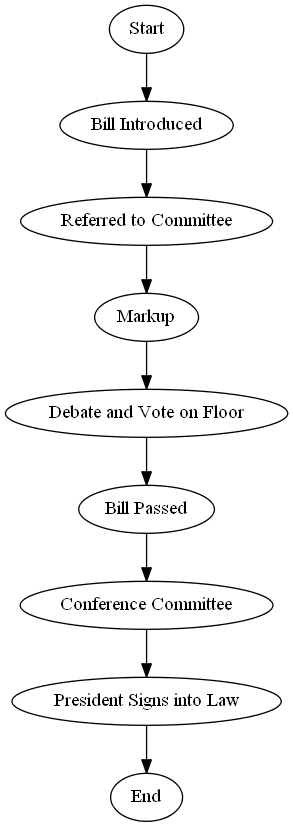
Process and Flow Charts
These charts show the steps in a process or how things flow from one point to another. Flowcharts and Gantt charts are common examples. Picture a news article diagram explaining how a bill becomes a law – this would be a great application of a flowchart.
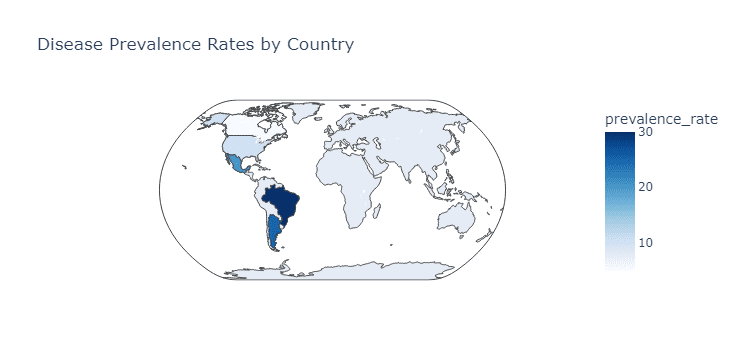
Spatial Charts
Spatial charts are all about showing data in relation to geography or physical space. Maps, choropleth maps, and cartograms are examples of spatial charts. Imagine a news article discussing the prevalence of a certain disease across different countries – a choropleth map would be an ideal way to visualize this data.
Now, let’s talk about the limits of these classifications. It’s important to remember that not all data can be easily visualized using these categories. Some charts, like treemaps or radar charts, may not fit neatly into one of these classifications. Additionally, the choice of chart type can sometimes be subjective, and the same data can be visualized in multiple ways depending on the message you want to convey.
In summary, while these chart-type classifications cover a wide range of visualizations, they may not capture every possible chart or be the only way to represent data. It’s always essential to consider the context and the goal of your visualization when choosing the best chart type.