Hey there! It’s Chip, and today, we’re going to talk about how to create a frequency table! 📊
A frequency table is a way to organize and summarize data by showing how many times each value or group of values appears in the dataset. Here are the steps to create a frequency table:
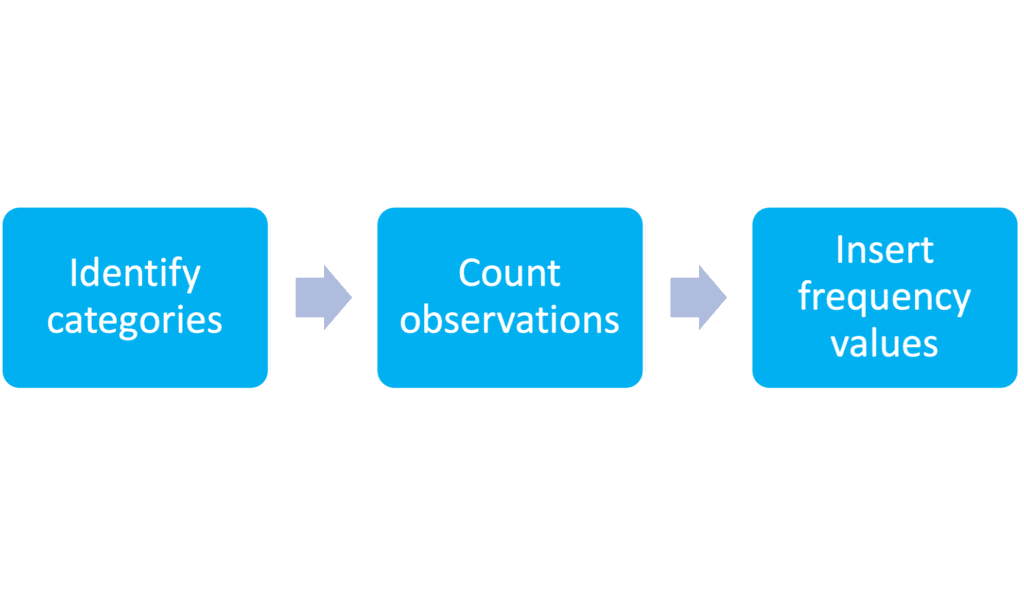
📈 Step 1: Identify categories. The first step is to identify the categories or groups that you want to use. For example, if you’re creating a frequency table for the ages of a group of people, you might use categories like 0-10, 11-20, 21-30, and so on.
📈 Step 2: Count the observations. The next step is to count the number of observations that fall into each category. For example, if you have a dataset of 20 people with ages ranging from 1 to 50, and you’re using categories of 0-10, 11-20, 21-30, and so on, you might count 2 people in the 0-10 category, 6 people in the 11-20 category, and so on.
📈 Step 3: Put frequency values in the cells. The final step is to put the frequency values in the cells of the frequency table. You’ll have one row for each category, with a label for each category in the left-hand column and the frequency count in the right-hand column. For example, your frequency table might look like this:
| Age Category | Frequency |
| 0-10 | 2 |
| 11-20 | 6 |
| 21-30 | 4 |
| 31-40 | 4 |
| 41-50 | 4 |
So, that’s how you create a frequency table! Now, let’s talk about how values are typically ordered in a frequency table.
Values are usually ordered from smallest to largest or from lowest to highest. For example, if you’re creating a frequency table for test scores, you might start with the lowest score and work your way up to the highest score. This makes it easier to see how the values are distributed and to identify any patterns or trends.
However, sometimes, it may be more useful to order values based on their frequency. For example, if you’re creating a frequency table for the colors of cars on a street, you might order the values based on the frequency of the colors, with the most common color first. This can make it easier to see which colors are most popular.
So, to summarize, values in a frequency table are usually ordered from smallest to largest or from lowest to highest, but sometimes, it can be useful to order them based on their frequency. The goal is to make it easy to see how the values are distributed and to identify any patterns or trends.