Have you ever encountered a cool-looking chart with overlapping circles and wondered what it’s called? Well, that’s a Venn diagram. Let’s dive in and explore what Venn diagrams are and how they can help us understand complex information.
Imagine you’re scrolling through your social media feed and seeing a post about people’s favorite ice cream flavors. You see three circles labeled “Chocolate,” “Vanilla,” and “Strawberry.” The circles overlap in different areas, creating distinct sections where people like one, two, or even all three flavors. That’s a Venn diagram in action.
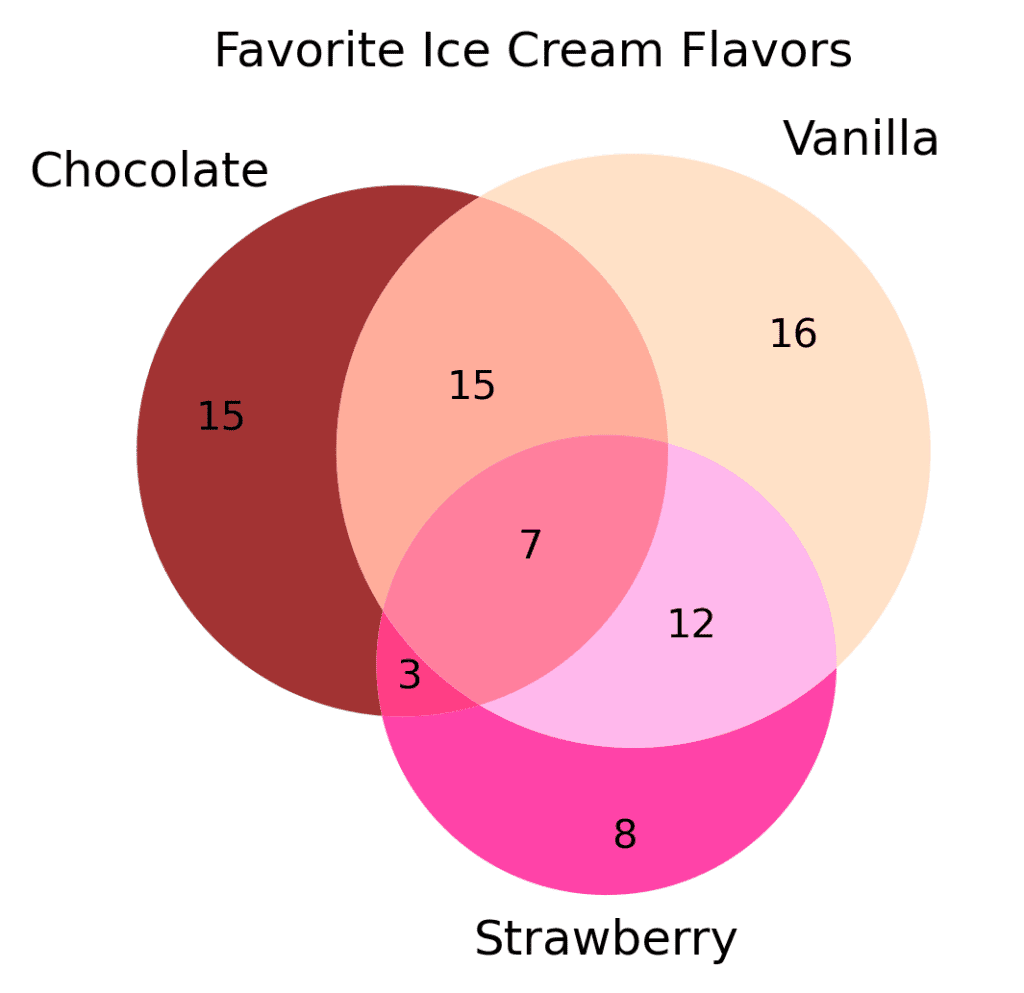
A Venn diagram is a simple yet powerful way to represent the relationships between different sets of data. The circles, or sometimes other shapes, represent distinct categories or groups. The overlapping areas show where these groups have something in common. By looking at a Venn diagram, we can quickly identify which elements belong to which group and how they relate to each other.
Venn diagrams can help you answer questions such as:
- What are the intersections between different sets?
- How many elements are unique to each set?
- What are the shared elements between sets?
Let’s look at another example. Imagine you’re reading a news article about animals, and there’s a Venn diagram with two circles. One circle represents “Mammals,” and the other represents “Aquatic Animals.” Where these two circles overlap, you’ll find animals like whales and dolphins because they belong to both groups.
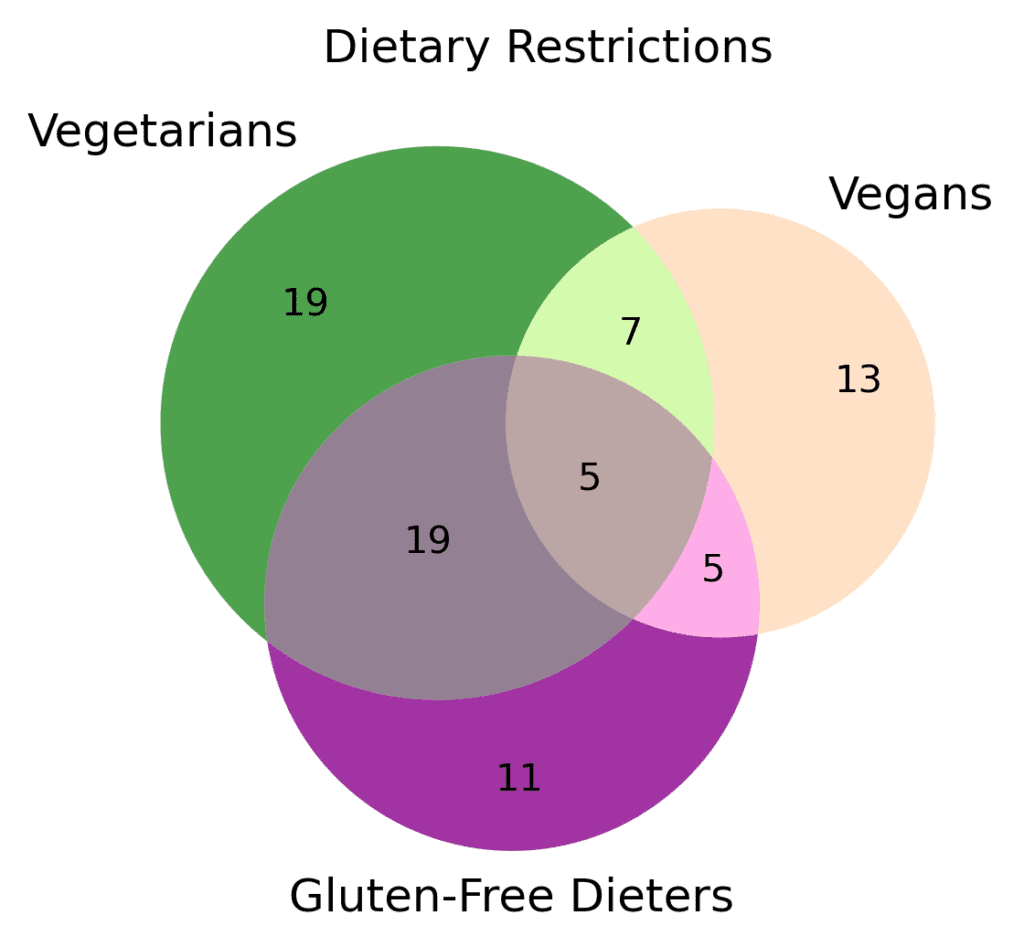
Now, let’s try a slightly more complex scenario. Picture a Venn diagram with three circles representing “Vegetarians,” “Vegans,” and “Gluten-Free Dieters.” In this diagram, the overlap between “Vegetarians” and “Vegans” might represent people who avoid meat but still consume dairy or eggs. The overlap between “Vegetarians” and “Gluten-Free Dieters” could represent those who avoid meat and gluten but not necessarily dairy or eggs. And finally, the overlap of all three circles would represent people who follow a vegetarian, vegan, and gluten-free diet.
Venn diagrams can be incredibly helpful in understanding complex relationships and making sense of large amounts of data. Visualizing this information makes it easier to grasp how different groups or categories relate to one another.