Variability, skewness, and kurtosis are all ways to describe different characteristics of a distribution.
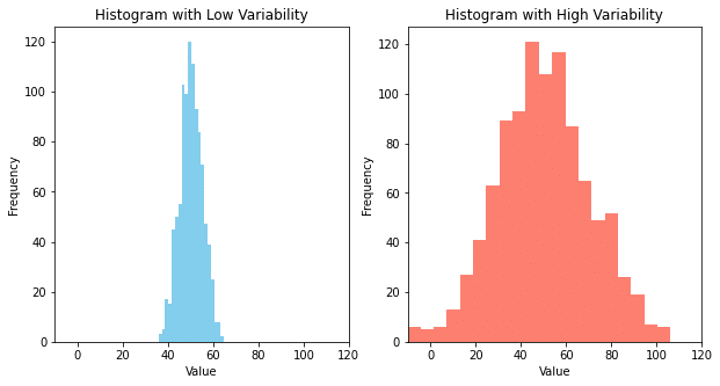
📈 Variability: Variability refers to how spread out the data is. A distribution with high variability has a wide range of values, while a distribution with low variability has a narrow range of values. For example, if we look at the test scores of a class of students, a high variability would mean that there is a wide range of scores, while a low variability would mean that most students scored around the same range.

📈 Skewness: Skewness refers to the symmetry of a distribution. If a distribution is symmetric, it means that it looks the same on both sides. If a distribution is skewed, it means that it’s not symmetric, and one tail is longer than the other. For example, if we look at the salaries of people in a company, a positively skewed distribution means that most people earn a low salary while a few people earn a high salary. A negatively skewed distribution means that most people earn a high salary while a few people earn a low salary.
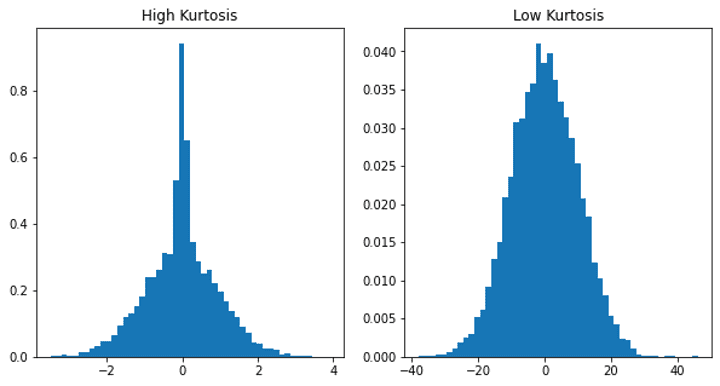
📈 Kurtosis: Kurtosis quantifies the “peakedness” or “tailedness” of a distribution, and it provides insights into how the distribution’s tails compare to those of a normal distribution:
- High Kurtosis: A distribution with high kurtosis has a peak that is sharper (more peaked) and heavier tails compared to a normal distribution. This indicates that the data has a concentration of values around the mean, and it may have one or more outliers in the tails. In a distribution with high kurtosis, the presence of outliers is more likely because the tails of the distribution are extended, meaning that extreme values are more common.
- Low Kurtosis: A distribution with low kurtosis has a flatter peak and lighter tails compared to a normal distribution. This suggests that the data is more spread out and less concentrated around the mean.
In a distribution with low kurtosis, the presence of outliers is relatively less common because the distribution is less peaked, and extreme values are less likely to occur frequently.
By examining the kurtosis of a dataset, you can gain insights into the likelihood of outliers. High kurtosis can signal the presence of extreme values in the tails of the distribution, while low kurtosis suggests that the data is more evenly spread out, with fewer outliers.
So, variability, skewness, and kurtosis are all ways to describe different characteristics of a distribution. They can help us to understand how the data is spread out and to identify any unusual patterns or outliers in the data.