Cartograms are an interesting and useful way to represent data visually. You might have seen them in news articles, blog posts, or on social media, but you might not have known what they were called.
So, what is a cartogram? A cartogram is a type of map where the areas of regions or countries are distorted to represent a specific data value, like population or economic size. It’s a cool way to visualize data that might be hard to grasp otherwise.
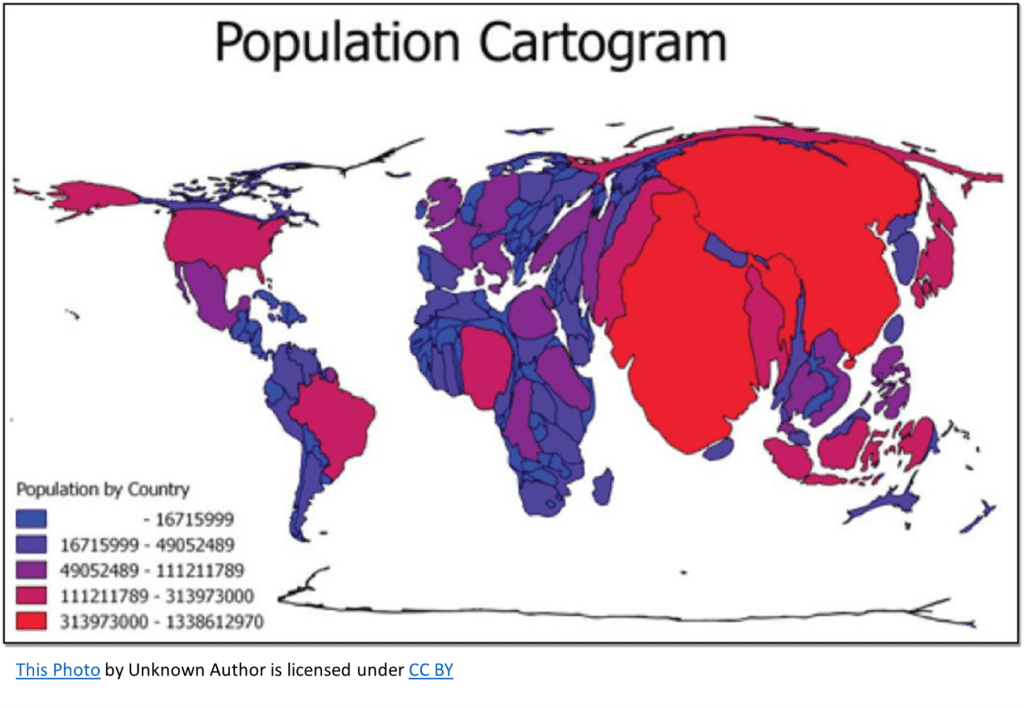
Imagine you’re looking at a map of the world, and you want to understand the population distribution across countries. A traditional map would show each country’s size, but it wouldn’t give you much insight into population density. That’s where a cartogram comes in!
In a cartogram, the size of a country is not determined by its actual land area but instead is resized based on the data being represented. So, if we were looking at a population cartogram, countries with higher populations would appear larger, and countries with smaller populations would appear smaller.
Let me give you an example: India and Canada. India has a much larger population than Canada, but Canada is physically larger in terms of land area. On a cartogram focused on population, India would be depicted as larger than Canada, helping you understand the population distribution better.
There are different types of cartograms, like continuous and non-continuous cartograms. Continuous cartograms maintain the original topology of the map, so the neighboring countries still touch each other, but their shapes are distorted. Conversely, noncontinuous cartograms may separate countries or regions, often resulting in a more abstract visualization.
A cartogram can answer questions such as:
- How does a specific variable vary across different geographic regions?
- Which regions have the highest or lowest values for a particular variable?
- Are there any geographic patterns or clusters in the data for the variable of interest?
Cartograms are great for understanding complex data in a visually appealing way. They can represent various data types, like GDP, CO2 emissions, or even election results.