In this article, we’re going to talk about something called a “flow chart.” Flow charts are really useful for understanding processes, systems, or the steps involved in completing a task. They are a type of visual representation that helps us quickly and efficiently sense information.
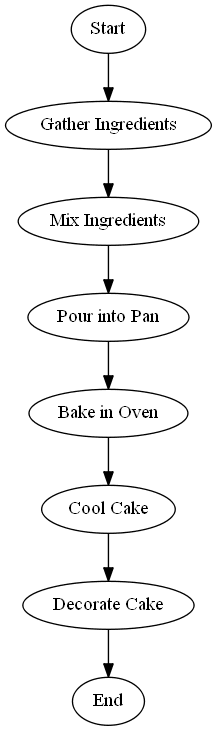
Imagine you’re watching a video on how to bake a cake. A flow chart could be used to show the step-by-step process from start to finish. You could have a box or shape representing each step – from gathering the ingredients to mixing, baking, and decorating the cake. Arrows would then connect these boxes, showing the sequence of steps and the flow of the process.
Flow charts can also help us understand more complex situations. Let’s say you’re reading an article about the process of recycling plastic bottles. A flow chart might show the different stages: collection, sorting, cleaning, processing, and manufacturing of new products. It could even include branching paths to show what happens when a bottle is not recyclable or when it’s reused.
Now, picture a flow chart as a map or a guide. It can help you navigate through a process or system, and it can also help you understand the relationships between different parts. Flow charts are an excellent way to break down complex information into digestible chunks, making it easier to understand and remember.
Flow charts can answer questions such as:
- What are the steps or processes involved in a system or task?
- How do different components within a system or task interact?
To sum it up, flow charts are powerful tools that help us visualize information, understand processes, and make decisions based on the sequence of events. They are widely used in various fields and can be a great aid when consuming visual information from different sources.