In this article, we will talk about something cool called a network chart or a network graph. Don’t worry if you haven’t heard of it before; by the end of this tutorial, you’ll understand what it is and how it can help you make sense of complex relationships in the real world.
So, what is a network chart? In simple terms, it’s a visual representation of relationships between different entities, like people, organizations, or even ideas. Imagine a bunch of dots (or nodes) connected by lines (or edges). The dots represent the entities, and the lines represent the relationships between them.
Network graphs can answer questions such as:
- How are different nodes (entities) connected or related within a network?
- What is the structure and complexity of the relationships in the network?
- Are there any prominent nodes or clusters within the network?
Let’s look at some real-world examples to make this idea more concrete.
Example 1: Social Media Connections
Think about your Facebook or LinkedIn connections. You’re connected to your friends, family, and colleagues, and they are connected to their friends, family, and colleagues, forming a vast web of connections. A network chart can show these connections, with each person being a dot and the connections being the lines. This way, you can easily visualize who knows whom and find out interesting patterns, like who the most connected person is or who might be the best person to introduce you to someone new.

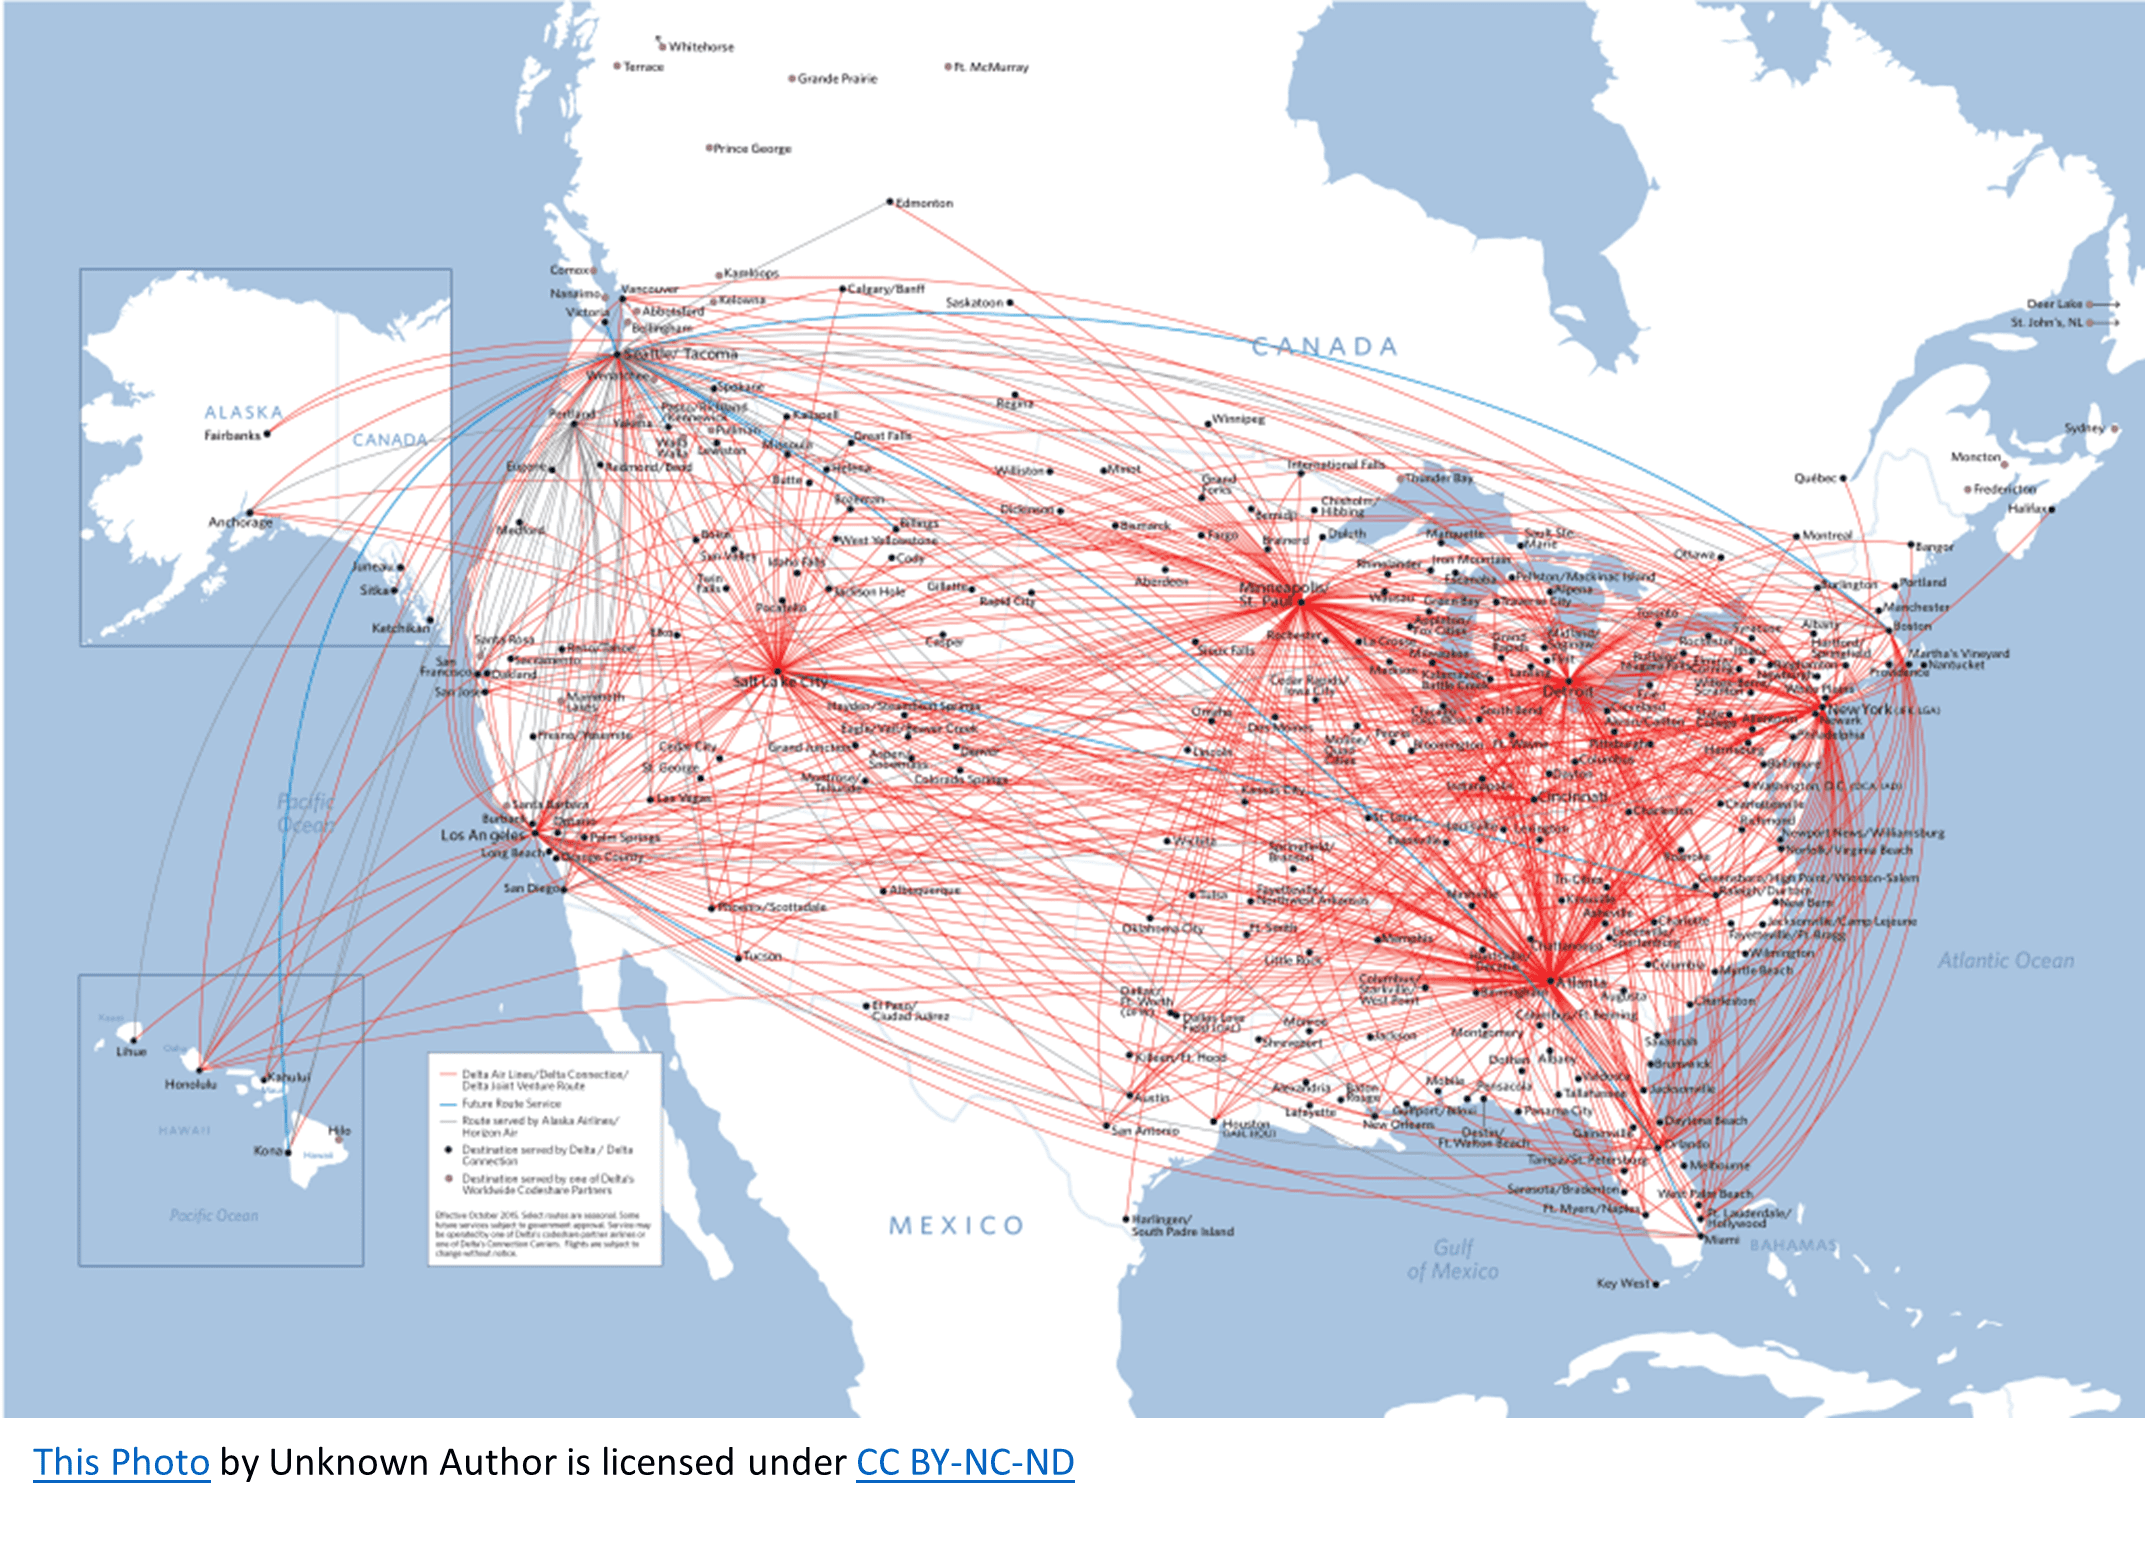
Example 2: Airline Routes
Another example of a network chart could be a map of airline routes. You might have seen those in-flight magazines with maps showing all the routes that an airline flies. Each city is a dot, and each flight route is a line connecting the cities. This network chart helps you see how different cities are connected and helps you plan layovers or multi-city trips more easily.
Example 3: Movie Actor Collaborations
One more example is a network chart of movie actors and their collaborations. Each actor is a dot; if two actors have worked together in a movie, they are connected by a line. This kind of chart can help you discover which actors frequently work together or which have the most extensive networks of collaborations.

By now, you should understand a network chart and how it can be used to visualize complex relationships in the real world. These charts are not only informative but can also be quite beautiful, depending on how they’re designed.