In this article, we’re going to explore the fascinating world of pictograms, also known as pictographs or picture graphs. These are simply visual representations that use pictures or symbols to display data in an easily digestible and engaging way. So, let’s dive in and see how pictograms can help us understand the world around us.
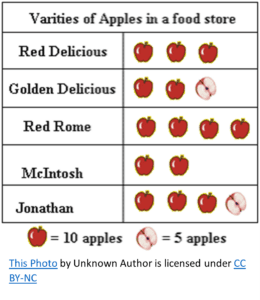
Imagine you’re scrolling through your social media feed, and you come across an interesting infographic about the most popular apples at a store. You see different apple types, each with a number of apple icons signifying how many were purchased. For example, one apple icon might represent 10 apples purchased. This is a pictogram in action. It allows you to see the data visually and quickly understand which types are more popular without having to read through a long list of numbers.
Pictograms can answer questions such as:
- How do different categories or values compare in a visually intuitive way?
- Which categories or values are the largest or smallest?
- Are there any notable patterns or trends in the data?
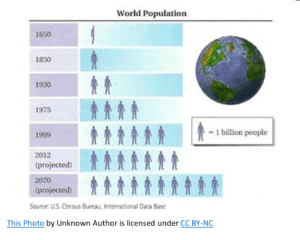
Now, let’s take a look at another example. Suppose you’re reading a news article about the world’s population over time. Instead of simply listing the years and population, the article shows a small illustration of a person next to the year, with each icon representing 1 billion people. By glancing at the pictogram, you can easily compare how quickly the world’s population is increasing and grasp the information more effectively.
Pictograms can also be used to represent more abstract data. Imagine a blog post discussing the percentage of people who prefer different ice cream flavors. The post could include a pictogram with ice cream cones representing 10% of the population each. The more cones of a certain flavor, the more popular it is.
As you can see, pictograms are a fun and effective way to present data, making it easier for people to understand and remember. They’re especially useful when dealing with a non-technical audience, as they can break down complex information into engaging and relatable visuals.