In this article, we’re going to talk about an interesting type of data visualization called a “tree map.” Treemaps are great for showing hierarchical data and part-to-whole relationships. They help us understand complex data in a simple and visually appealing way. Imagine you’re scrolling through your social media feed, and you come across a colorful chart with different-sized rectangles. That’s a tree map.
A tree map is essentially a collection of nested rectangles, where each rectangle represents a category or an item. The size of the rectangle indicates the value or importance of that category, while the color can be used to show additional information, such as growth rate or percentage change.
Treemaps can help you answer questions such as:
- How is the data hierarchically organized?
- What are the relative sizes of different categories?
- How do subcategories contribute to the overall category?
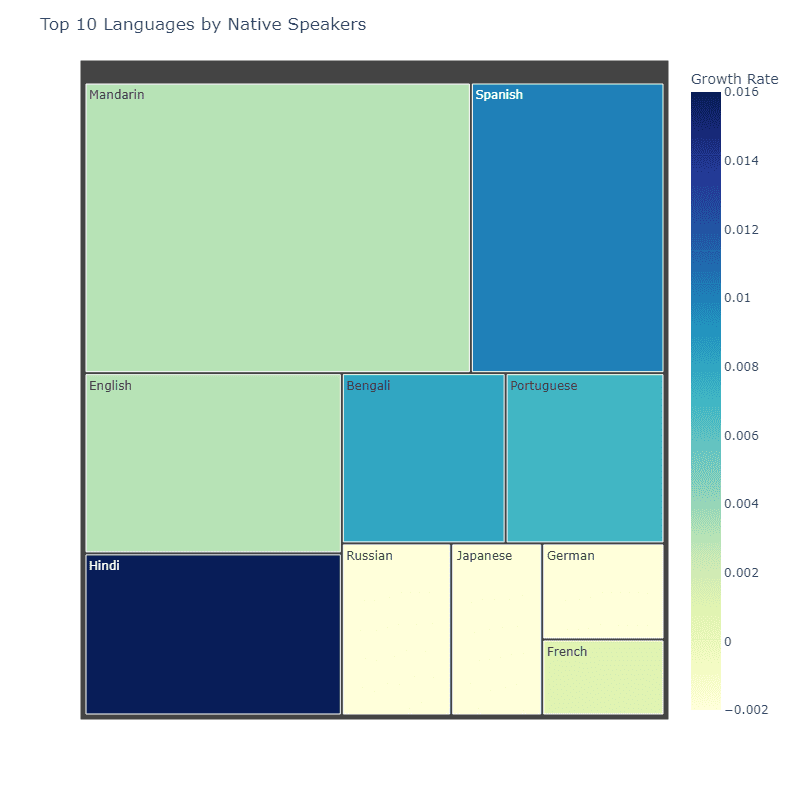
Let’s take an example to understand this better. Imagine you’re reading a news article about the world’s most spoken languages. The article features a tree map showing the top 10 languages by the number of native speakers. You’d see a collection of rectangles, with each rectangle representing one language. The larger the rectangle, the more native speakers that language has. Additionally, the rectangles could be color-coded to show the growth rate of each language’s speaker population.
Now, let’s picture a tree map in a different context. Say you’re browsing through a blog post about the most popular movies of all time. The blog post has a tree map showcasing the top 50 movies, with rectangles representing each movie. The size of the rectangle indicates the movie’s total box office revenue, while the color could be used to represent the genre. This helps you quickly spot the highest-grossing movies and their genres at a glance.
Here’s a simple way to remember the key aspects of a treemap:
- Rectangles: Represent categories or items.
- Size: Indicates the value or importance of the category.
- Color: Can be used to show additional information.
So next time you come across a tree map, remember these pointers and enjoy the insights it provides! Treemaps are an engaging and effective way to consume complex data in an easy-to-understand format.