A waterfall chart is a type of chart that helps us understand how an initial value is affected by a series of positive and negative changes. It’s called a “waterfall” chart because the columns in the chart look like they’re cascading, similar to a waterfall.
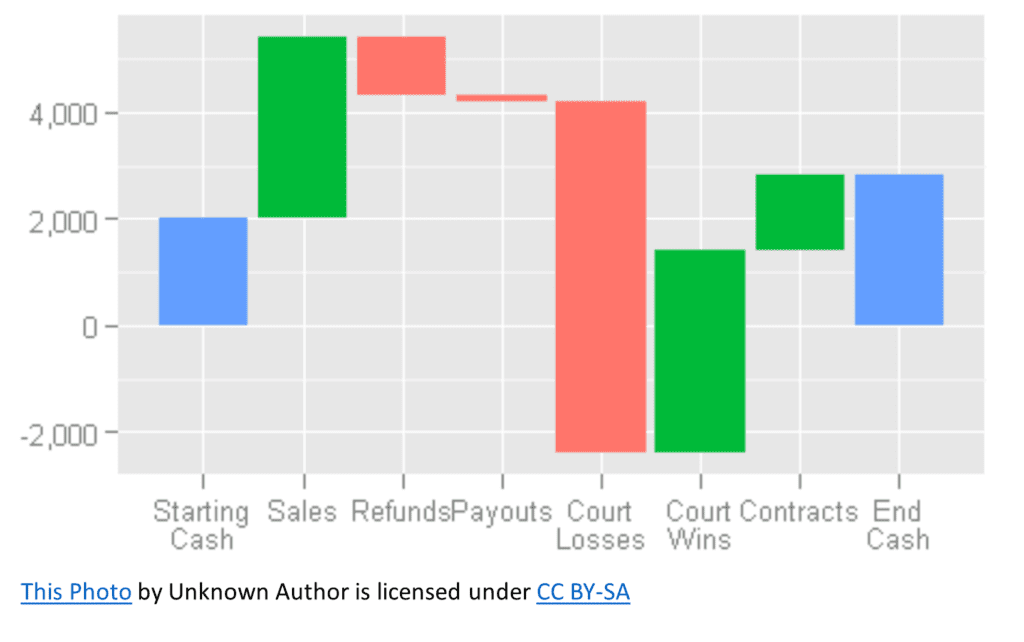
Imagine you’re following the financial journey of a small business. The business starts with a certain amount of money (let’s say $2,000), and over time, there are various gains and losses (like sales, refunds, and payouts). A waterfall chart can help you visualize how these gains and losses impact the initial amount, ultimately showing the final value.
Waterfall charts can help you answer questions such as:
- What is the cumulative effect of sequential events or changes?
- How do individual events or changes contribute to the overall change?
- Are the changes in value predominantly positive or negative?
Here’s a simple breakdown of a waterfall chart:
- The first column represents the starting value (e.g., $2,000).
- Subsequent columns show the increases (positive values) and decreases (negative values) that impact the starting value.
- The final column displays the ending value after all the changes have been accounted for.
To help illustrate this concept, imagine a horizontal axis representing different categories (like sales, refunds, and payouts) and a vertical axis representing the dollar amounts. The chart consists of vertical bars connected by horizontal lines, which makes it easy to see the flow of the changes.
When you look at a waterfall chart, focus on the overall pattern and trends. This will help you get a sense of how different factors contribute to the final outcome. For instance, you might notice that a business is gaining a lot of revenue through sales, but the expenses are also quite high, which could indicate an area for improvement.
Waterfall charts are especially useful when you want to understand the cumulative impact of multiple factors on an initial value. They’re commonly used in finance and business analysis but can also be applied to other fields like project management, energy consumption, and personal finance.