In this article, we’re going to talk about different chart types that can help us visualize processes or workflows.
Flowcharts
A flowchart is a fantastic way to represent a process or workflow. Imagine you’re reading a news article about how a bill becomes law. A flowchart can break down the different steps involved, such as bill introduction, committee review, voting, and finally becoming law. It’s a very clear and easy-to-understand way of representing the process.

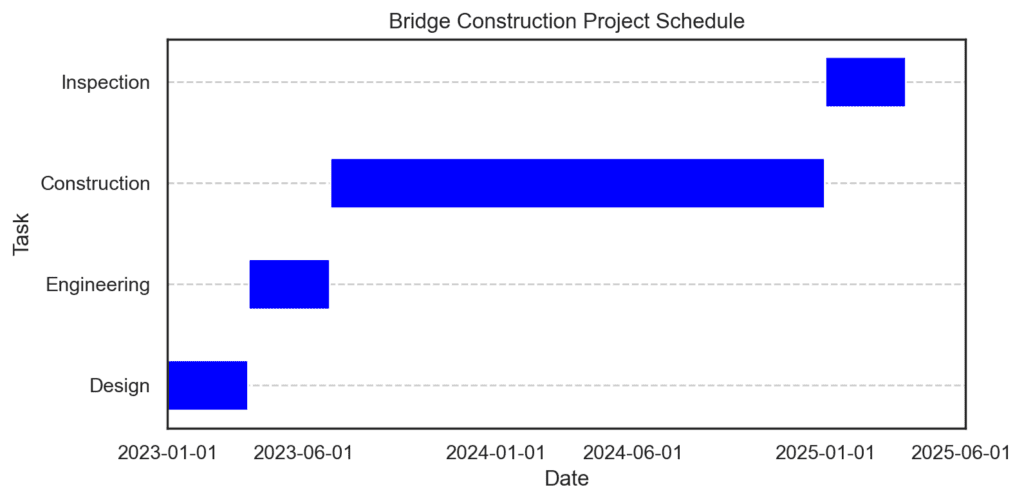
Gantt charts
Gantt charts are perfect for illustrating project timelines or schedules. Let’s say there’s a blog post about the construction of a new bridge. A Gantt chart can show the timeline of various tasks involved, like design, engineering, construction, and inspection. It’s an excellent visual for understanding the sequence and duration of tasks in a project.
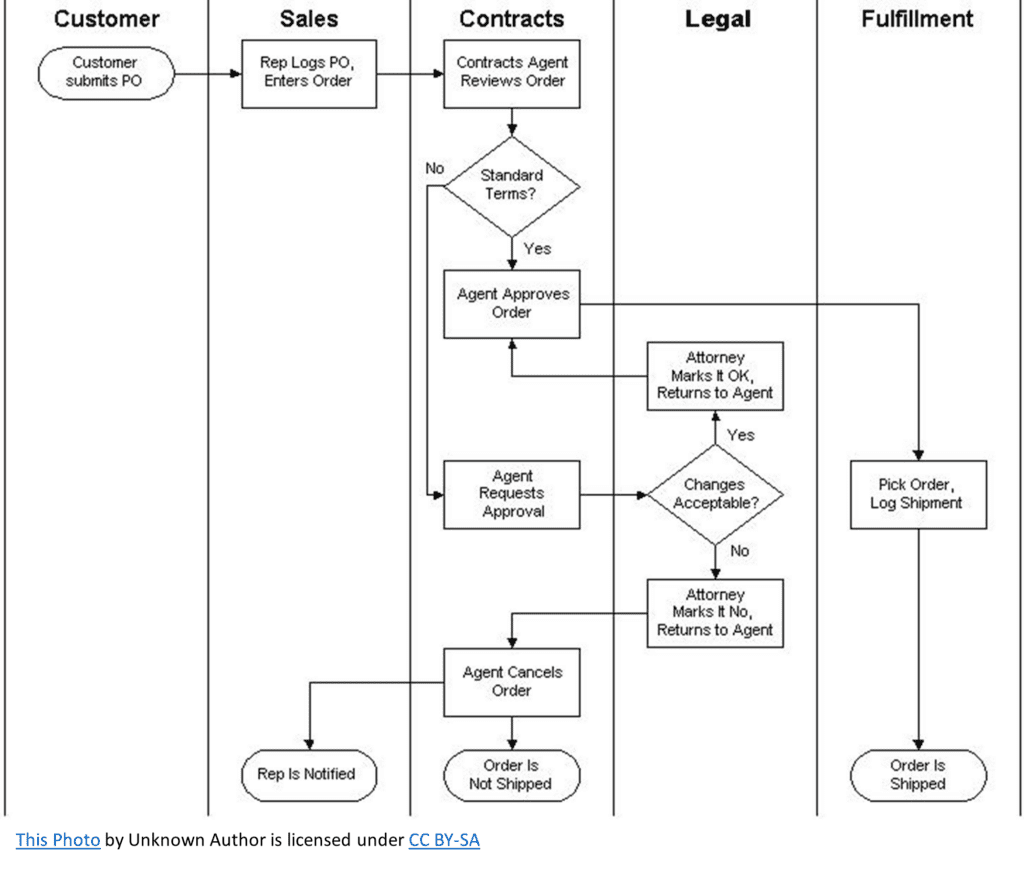
Swimlane diagrams
Swimlane diagrams are another way to represent processes, especially when there are multiple parallel workflows or actors involved. Picture an infographic about how different parties are needed to fulfill a purchase order. Swimlane diagrams can clearly represent the roles and responsibilities of each group and how they interact with each other throughout the order.
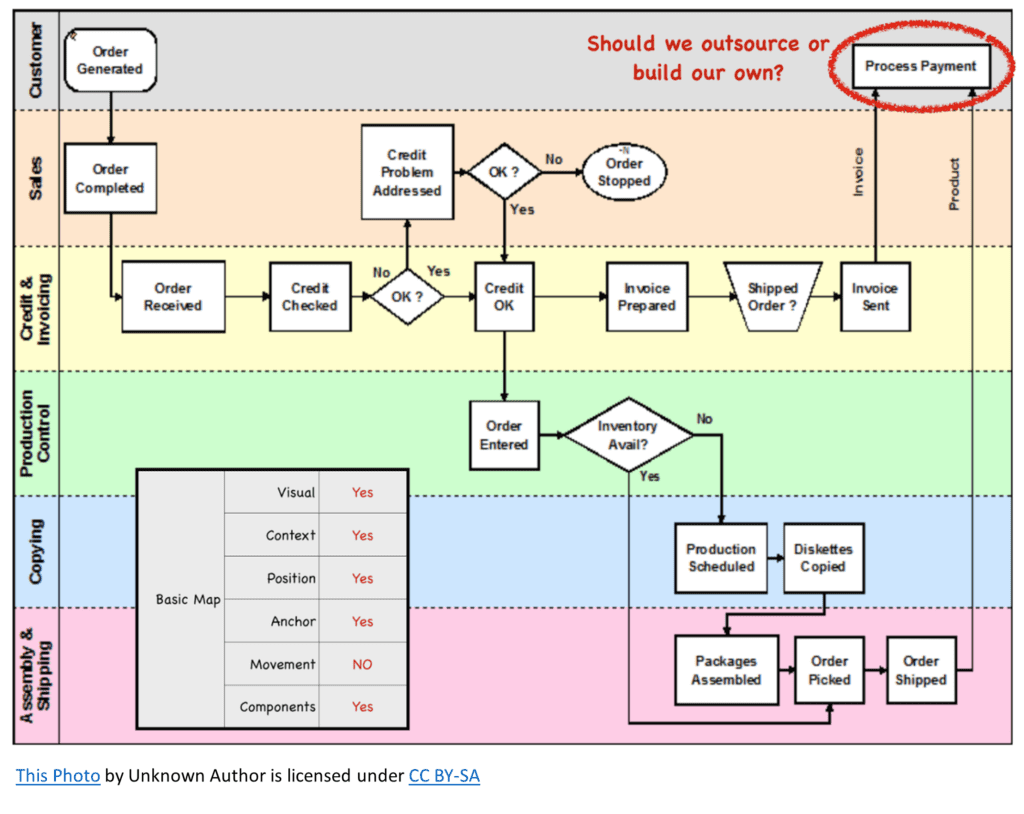
Process maps
Process maps are a bit similar to flowcharts but focus more on the detailed steps of a specific process. Imagine a company document about how to process a payment. A process map could display the various stages, such as customer, sales, and production control.
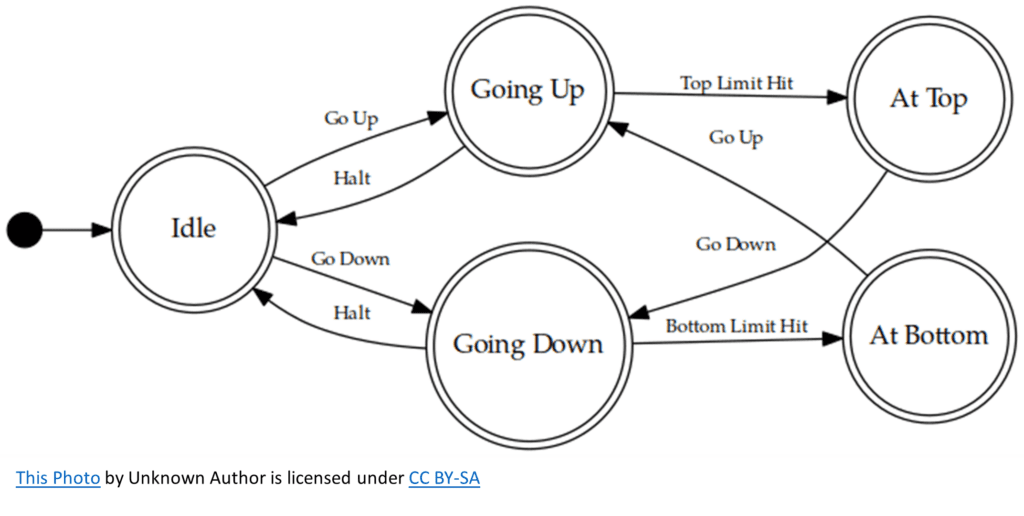
State diagrams
State diagrams are useful for showing the different states of an object or system and how it transitions between them. For example, you might find a state diagram in an article about airplanes, showing the decisions made by pilots when ascending and descending.
As you can see, there are various chart types that can help you visualize processes in an engaging and easy-to-understand way.