In this article, we’re going to talk about some common chart types that display trends over time. These charts are very useful when it comes to understanding how data changes over time, and you’ve probably seen them in the news, blog posts, or social media.
Line charts
Line charts are probably the most common type of chart used to display trends over time. They consist of a series of data points connected by a line. For example, imagine you want to see the fluctuations in temperature. You might see a line chart showing a particular stock’s value over several days or months. Each point on the line represents the stock’s value at a specific date, and as you move from left to right, you can see how the value has changed over time.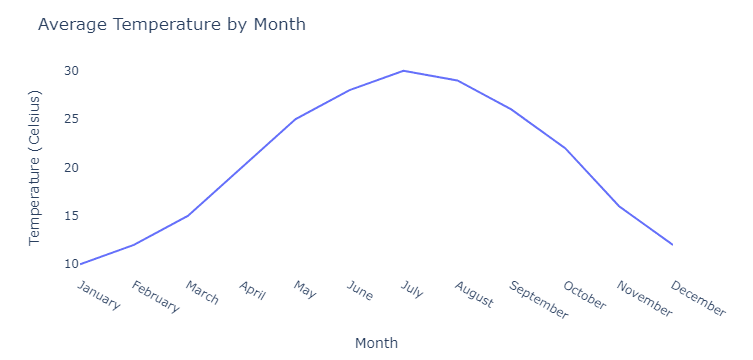
Area charts
Area charts are quite similar to line charts, but they come with a twist. Instead of just a line, area charts also fill the space between the line and the x-axis with color or shading. This can help emphasize the magnitude of changes over time. Let’s say you’re looking at a chart that shows a city’s population growth over several decades. An area chart would not only show the change in population over time but also give you a sense of the total population during that period.
Bar/Column charts
Bar and column charts are great for comparing data across different categories or time periods. For instance, if you were interested in seeing the average temperature for each month of the year, you could use a column chart. Each column would represent a month, and the height of the column would indicate the average temperature for that month.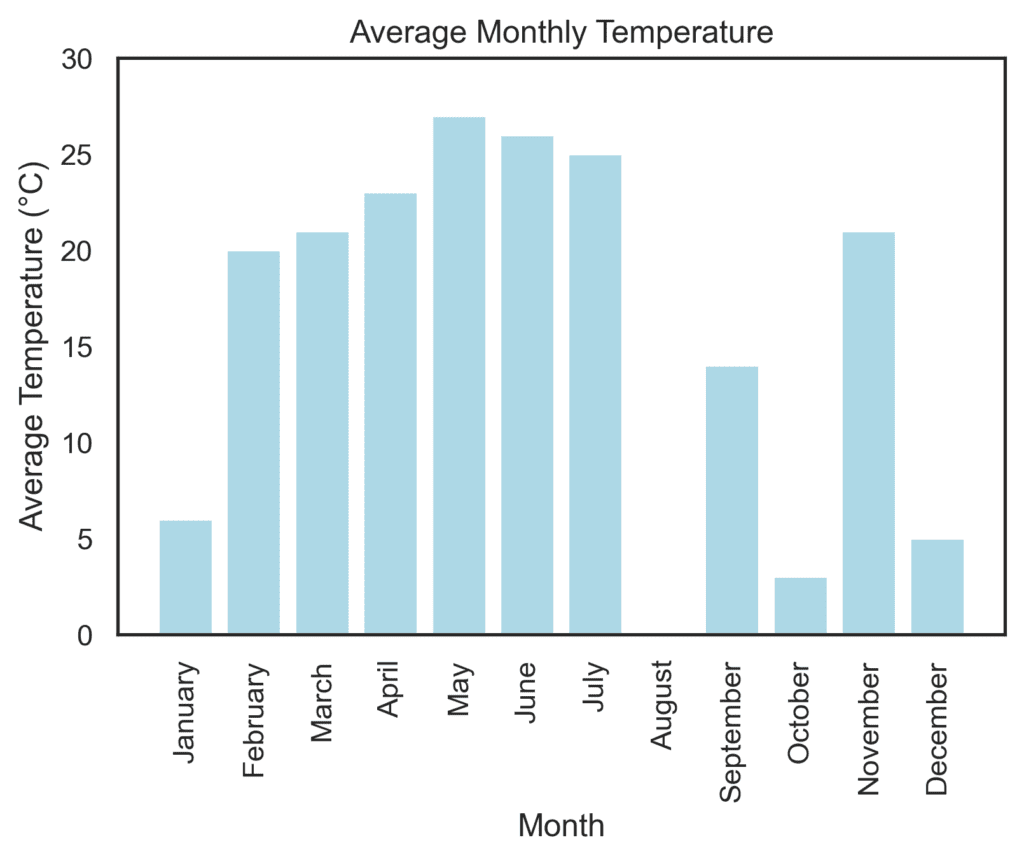
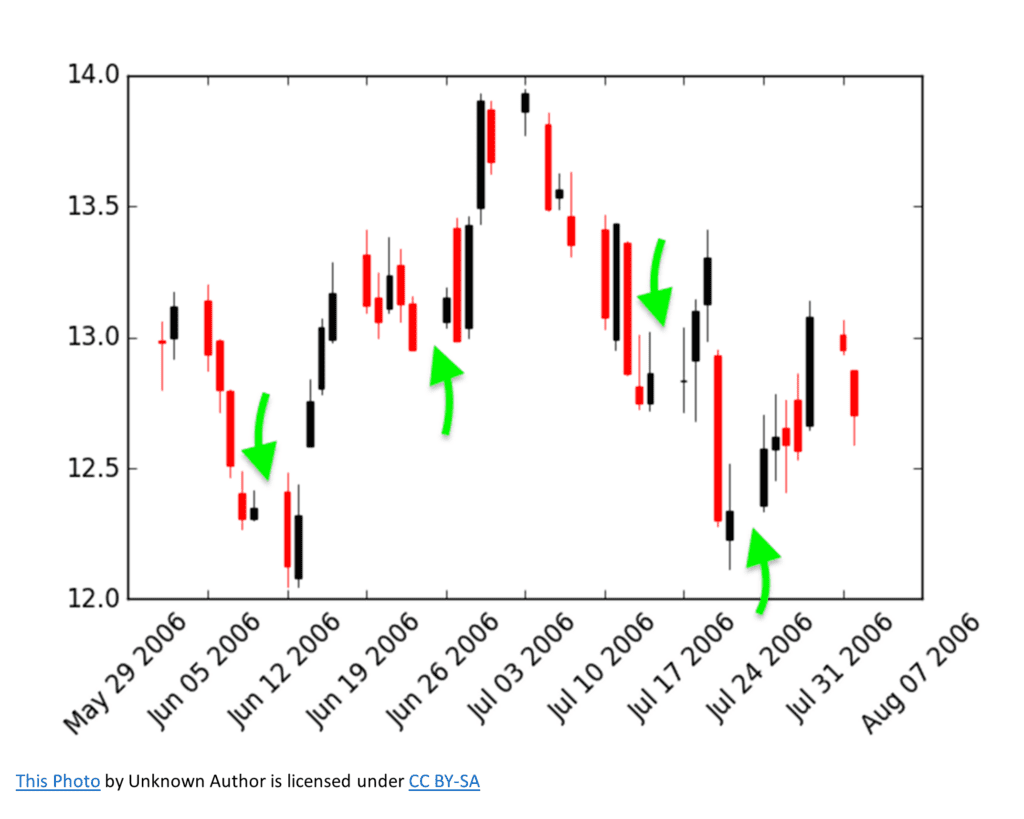
Candlestick charts
These are widely used in finance and investing to display the price movements of stocks, bonds, or other financial instruments over time. Candlestick charts show the opening, closing, high, and low prices for each time period. The body of the “candle” represents the range between the opening and closing prices, while the “wicks” show the high and low prices. This type of chart can help you visualize market trends and make informed decisions about buying or selling investments.