Hey, it’s Chip! Today, let’s talk about which charts you should use for each data type. 🤓
For categorical data, charts that show frequencies are the best way to explore the data. These include bar charts, pie charts, and stacked bar charts. 📊
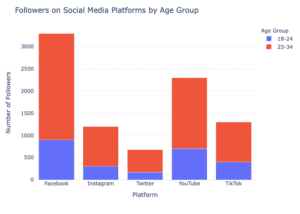
Bar Chart Stacked Bar Chart
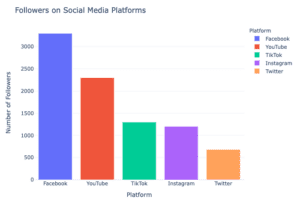
Bar charts show the frequency of each category in a rectangular bar, while pie charts show the frequency of each category in a circle.
Stacked bar charts show the frequency of each category and the subcategories that make up each category. These charts can help you see which categories are the most frequent and compare the frequencies of different categories. 📈
On the other hand, for numeric data, histograms and box plots are the best charts to explore the data. 📏
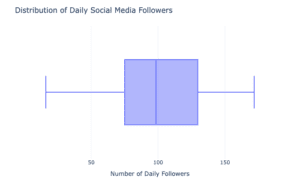
Histogram Box Plot
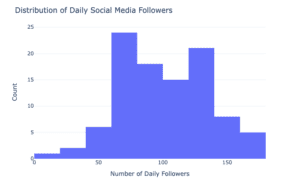
Histograms show the distribution of the data by grouping values into bins and displaying the number of values that fall into each bin.
Box plots show the distribution of the data by showing the median, quartiles, and outliers. These charts can help you see the shape of the distribution and identify any outliers or unusual values. 🔢
It’s important to choose the appropriate chart based on the type of data you have to accurately analyze and interpret your data. 📊📈
In summary, charts that show frequencies, like bar charts and pie charts, are best for exploring categorical data, while histograms and box plots are best for exploring numeric data. Choosing the right chart can help you visualize your data more effectively and make more accurate conclusions. 👀